This post was written in 2020. It was rewritten and republished in 2025.
Rye Bread
Flour
Flour, a product of grinding or milling grain, is a commodity used by bakers to bake bread. The characteristics of flour depend on the grain and the milling process. This is known to persons who have mixed dough and worked with dough, and to persons who have baked bread – whether in large or small commercial bakeries or at home, regardless of gear.
Bread was made with rye flour in parts of Eurasia where rye grew, including the parts of Northern Europe, including the lands around the Baltic Sea. Rye grain has proteins, but rye flour does not enough of the proteins that bind to form gluten. Rye bread, when baked, does not rise like a leavened wheat bread. Rye flour, unlike other flour has proteins called pentosans. Peter Reinhart notes in The Bread Baker’s Apprentice at p. 185 that rye flour has different protein profile than wheat flour, and forms gluten differently, it uses glutelin to form gluten, unlike wheat flour which has glutenin. Reinhart also notes that rye flour has pentosans, which absorb water differently and make the dough gummy. According to Daniel DiMuzio’s Bread Baking, An Arisan’s Perspective:
(p. 51) pentosans absorb water with very little mixing and are fragile, breaking down and releasing water after as little as 3-4 minutes of intensive mixing;
(p. 51) bakers using mixing machines use a short period of slow mixing for dough with significant amounts of rye flour, and little intensive mixing;
(p. 216) dough for deli-style light rye (70% white/30% rye) would be hydrated at 68% and mixed slowly: in a stand mixer, 3 minutes slow to blend ingredients and 3 minutes on second speed.
The hydration of dough made with rye flour is affected by the way the pentosans in rye flour release water. There are other factors. Some recipes call for light or medium rye flour which is produced from rye endorsperm (i.e. not whole grain rye) with more screenings. Dark Rye flour uses more whole grain. Some recipes specifically call for dark rye flour or call for it as an alternative to medium rye flour. There is a range of conversion weights, for different kinds of rye flour; there are variations of methodology of measuring a cup to weigh:
Online Conversion’s converter and Aqua-Calc converter – 1 cup of dark rye flour = 4.5 oz. = 128 g.
Bakery Network conversion chart – 1 cup “rye flour” = 4 oz. = 113 g.
Aqua-Calc converter light rye flour (or medium rye flour) – 1 cup = 102 g = 3.6 oz.
The Traditional Oven’s converter – 1 cup = 102 g. = 3.6 oz. light rye?
Anita’s Organic Mill Organic Rye Flour is available in 1 kg. bags in some local stores and online. This may be a better quantity to buy for flour used in 1 to 1.5 cup quantities than Rogers Dark Rye Flour, in 2.5 kg. bags. For both of those rye flours, the Canadian Nutrition Facts label indicates 1 cup = 120 grams = 4.2 oz. Nutrition Facts labels use values based on food databases based on the measurement standards of their methodology. Anita’s is about 120 grams a cup if settled and scooped to pack the cup. Rogers Foods Dark Rye Flour is available locally in 2.5 kg. bags, and priced as a staple. Its Nutrition Facts label says ¼ cup weighs 30 g. Online Conversion’s converter and Aqua-Calc converter dark rye flour said 1 cup of dark rye flour = 4.5 oz. = 128 g. This is the mean or average for dark rye flour surveyed in USDA data base. Rogers Dark Rye may be about 124 grams a cup, settled and scooped.
Rye bread often contains caraway seeds; consumers associate the flavour with rye bread. Caraway is related to cumin, fennel, anise, carrots, celery and parsley. Some varieties are known as Persian cumin. Caraway has been used as a cooking herb or spice since the time of the Roman Empire. It is a major spice in Central European cooking and in the nations beside the Baltic. It was adopted in Germany, the Nordic countries, the “Low” countries and England. Caraway seeds were/are used to make flavoured breads with white flour in Central European recipes. Cumin and caraway are the spices in spiced Dutch Kamijnekaas 1literally “Cumin cheese” – Leiden Kaas and spiced Gouda. Other flavoring agents in baking light rye breads: fennel and anise seeds, chopped onion, dried orange peel, orange zest and orange oil. There are dark or sour light rye styles with bread flour, rye flour and:
an agent (molasses, cocoa or ground coffee for home bakers) for dark colour,
vinegar or sour cream for acidity, and
corn meal, oatmeal or sunflower seeds for texture.
Bread Varieties
Pumpernickel may refer to bread made from 100% rye flour, according to medieval recipes. These loaves are a specialty product. Many grocery stores sell commercially baked pumpernickel. It is flat, compact, usually brown or black. There are some American recipes for a rustic style made with a large amount of rye flour, e.g. King Arthur Classic Pumpernickel baked in an oven.
There are industrial formulas and home recipes for light rye bread, baked in an oven. Most commercial and home made rye bread is made with wheat flour with rye flour or rye meal. Light rye breads are soft breads, with fairly close crumb and a distinct dark crust – chewy but not crunchy. There are rustic rye and rye sourdough styles. There are deli styles and reconstructions of local bakery styles. Light rye recipes often produce torpedo shaped loaves rather than pan loaves. There is a Winnipeg style, a bread flour loaf with a small amount of rye flour and/or rye meal or chopped rye berries. The Winnipeg Free Press had recipes based on the rye bread baked by Winnipeg’s City Bread. There is a bread machine version that I have not tried.
Many formulas/recipes for oven baked light rye are based on north European (German and Scandinavian) light rye bread recipes, with white flour and some rye flour or meal. Russians, Ukrainians and East Europeans also made light rye bread with a blend of white flour, whole wheat flour and rye flour. American rye bread recipes usually involve a blend of rye flour with wheat flour. Some recipes that are made with a blend of rye and wheat flour, (i.e. light rye bread), will make the crumb dark by including cocoa or coffee. This style may be called pumpernickel in the title of a recipe
Bread Machine Recipes
Limitations
100% rye flour bread is not made with bread machines.
Modern machines (machine manufactured since about 2005)have been optimized by manufacturers to have features to attract buyers. Most work with bread flour and whole wheat flour. Most also work with “gluten-free” recipes which many users hope to bake. Modern bread machines don’t handle rye flour. The main factors are the strong kneading action of modern machines and the length of the mix/knead programs.
A dough with too much water may throw off some wet dough sheets that bake as crackers or as a thick crunchy crust. Unless the mixing time is kept short, the rye flour will absorb and then release water and mix a dough that will not bake without issues.
Manuals and Books
Some bread machine manufacturers explicitly discourage baking with rye flour. Some Panasonic manuals said rye flour leads to dense bread when used to replace other (wheat) flour in their recipes and warned that using rye flour might overload the motor. Modern machines have almost dropped rye from the manuals.
There are recipes for light rye breads among the recipes included in manuals for machines I have used, involving small amount of rye flour and some other flavour agents associated with light rye loave:
Bread with Caraway and Onions in the Panasonic SD-YD250 manual for a medium loaf (1.5 lb.) – 1/8 cup of rye flour, 3 cups of bread flour, and caraway seeds, with nearly identical to Panasonic’s Basic White Bread.
Zorjirushi has a recipe in the BB-PAC20 manual with 2/3 cup of rye flour and 4 cups of bread flour to make a large loaf.
Some “bread machine” recipes suggest that the dough for a light rye bread loaf can be mixed, kneaded and baked in a bread machine. It depends on the machine and the baking program.
The light rye bread bread machine recipes in Beth Hensperger’s books:
the Bread Lover’s Bread Machine Cookbook (at pp. 133-143, 313), and
the bread machine chapter of the Bread Bible,
use the basic bake or bake whole wheat programs. I have tried Swedish Rye Bread, a limpa style, from BLBMC, Scandinavian Light Rye, and Narsai’s Rye Bread. The latter is a bread machine recipe in Beth Hensperger’s Bread Bible. It gets a brown colour from molasses. Those recipes use 1 cup or more rye flour and 1¼ cups of water in medium recipes with 2 cups of bread flour. The rye flour is over 30% of the total flour and the hydration is 70%. Those recipes worked in older bread machines, but they do not work in many machines.
When I baked BLBMC light rye bread recipes in the Panasonic and Zojirushi, the machines mixed a dough that looked reasonable in the first 10 minutes of kneading, but was wet by the end of knead time. It rises; when it falls at the knockdowns, it leaves a wet dough residue clinging to the pan which bakes as cracker or flat bread against the edge of pan. This result is produced by a combination of kneading, and over-generous hydration.
Preset and Custom
No bread machine manufacturers made machines with factory programs for light rye loaves. The basic bake and whole wheat programs for bread machine baking are not adjustable. Modern machine programs mix and knead dough for about 20 minutes, to work the dough and build gluten for yeasted bread made with wheat flour. The dough progam will be close to 20 minutes. The gluten-free program and the “cake” program (for unyeasted baking) also mix for about 20 minutes. The kneading action in all programs for the Zojirushi machine seems to be equally intense and fast.
Some bread machines can be programmed with custom cycles. I have tried to use the Zojirushi BB-PAC20, in a custom program with a short “knead” phase. A short mix does not lead to success. The Zojirushi custom (“home-made”) programs cannot be set to knead for less than 5 minutes. This will mix a light rye that is well less than 30% rye flour by weight. The homemade programs allow adding to the rise time, which allows more fermentation and rise. It is difficult to bake a light rye loaf smaller than a bread machine “medium” loaf in a Zojirishi horizontal pan machine.
Success
I was able to bake decent light rye loaves following recipes that involved a short period of kneading with a stand mixer at low speed and the use of a conventional kitchen oven.
The US Department of Agriculture Agricultural Research Service’s FoodData Central (“USDA FDC”) can search 5 data sets. It may be necessary to search in each set. The American government collects or tests samples for the FNDDS Survey Foods data set, but not the others. The government requires tests from accredited services at a manufacturer or distributor’s expense in most instances.
Other countries, including Canada, have data sets on products offered for sale in those countries. The data comes from manufacturers or hired services. Government or independent testing is limited.
The USDA FDC data sets are:
Foundation Foods,
Standard Reference Legacy Foods,
Human Research Center Food and Nutrient database for Dietary Studies (“FNDDS Survey Foods”),
diet guides and cookbooks. The AHA sells a Low-Salt Cookbook, first published in 1990. The 2011 4th edition is the most modern, and is currently for sale on the internet at the AHA website;
Blood pressure is classified by two measurements, the systolic and diastolic pressures, which are the maximum and minimum pressures, respectively. For most adults, normal blood pressure at rest is within the range of 100–130 millimeters mercury (mmHg) systolic and 60–80 mmHg diastolic. For most adults, high blood pressure is present if the resting blood pressure is persistently at or above 130/80 or 140/90 mmHg. … Ambulatory blood pressure monitoring over a 24-hour period appears more accurate than office-based blood pressure measurement.
Physicians in most places diagnose hypertension on the basis of blood pressure readings, and treat it by prescribing anti-hypertensive medication and testing patients periodically. A few countries cover the cost of prescribed medications under health insurance or drug cost insurance.
Lifestyle changes and medications can lower blood pressure and decrease the risk of health complications. Lifestyle changes include weight loss, physical exercise, decreased salt intake, reducing alcohol intake, and a healthy diet. If lifestyle changes are not sufficient, then blood pressure medications are used. Up to three medications taken concurrently can control blood pressure in 90% of people. The treatment of moderately high arterial blood pressure (defined as >160/100 mmHg) with medications is associated with an improved life expectancy. The effect of treatment of blood pressure between 130/80 mmHg and 160/100 mmHg is less clear …
….
The first line of treatment for hypertension is lifestyle changes, including dietary changes, physical exercise, and weight loss. Though these have all been recommended in scientific advisories, a Cochrane systematic review found no evidence for effects of weight loss diets on death, long-term complications or adverse events in persons with hypertension.The review did find a decrease in body weight and blood pressure.Their potential effectiveness is similar to and at times exceeds a single medication. If hypertension is high enough to justify immediate use of medications, lifestyle changes are still recommended in conjunction with medication.
Dietary changes shown to reduce blood pressure include diets with low sodium, the DASH diet (Dietary Approaches to Stop Hypertension), and plant-based diets. … There is evidence from randomized, double-blind, placebo-controlled clinical trials that Hibiscus tea consumption significantly reduces systolic blood pressure (-4.71 mmHg, 95% CI [-7.87, -1.55]) and diastolic blood pressure (-4.08 mmHg, 95% CI [-6.48, -1.67]). Beetroot juice consumption also significantly lowers the blood pressure of people with high blood pressure
Increasing dietary potassium has a potential benefit for lowering the risk of hypertension. The 2015 Dietary Guidelines Advisory Committee (DGAC) stated that potassium is one of the shortfall nutrients which is under-consumed in the United States. However, people who take certain antihypertensive medications (such as ACE-inhibitors or ARBs) should not take potassium supplements or potassium-enriched salts due to the risk of high levels of potassium.
Wikipedia, September 2022, Hypertension
Doctors often prescribe medications to reduce blood pressure to levels under 140/90. Medical care is often dedicated to managing medications and adverse side-effects. The medications have adverse side-effects. ACE inhibitors (e.g.), can cause persistent dry coughing, among other things. Calcium channel blockers (e.g. Amlodypine) often cause peripheral edema.
In the short run, drinking alcohol increases blood pressure for a short period after consumption. One drink will raise blood pressure for about two hours. Long term regular drinking contributes to hypertension, The causation is still under discussion. A 2014 paper says:
… the mechanism through which alcohol raises blood pressure remains elusive. Several possible mechanisms have been proposed such as an imbalance of the central nervous system, impairment of the baroreceptors, enhanced sympathetic activity, stimulation of the renin-angiotensin-aldosterone system, increased cortisol levels, increased vascular reactivity due to increase in intracellular calcium levels, stimulation of the endothelium to release vasoconstrictors and loss of relaxation due to inflammation and oxidative injury of the endothelium leading to inhibition of endothelium-dependent nitric oxide production. Loss of relaxation due to inflammation and oxidative injury of the endothelium by angiotensin II leading to inhibition of endothelium-dependent nitric oxide production is the major contributors of the alcohol-induced hypertension. For the prevention of alcohol-induced hypertension is to reduce the amount of alcohol intake. Physical conditioning/exercise training is one of the most important strategies to prevent/treat chronic alcohol-induced hypertension on physiological basis. The efficacious pharmacologic treatment includes the angiotensin-converting enzyme (ACE) inhibitors or angiotensin II type 1 receptor blockers (ARBs) which have antioxidant activity and calcium channel blockers.
Caffeine can elevate blood pressure temporarily, which will affect blood pressure readings. It is not discussed as a significant lifestyle or dietary factor causing hypertension.
Sodium
Salt
Salt is found as a crystalline solid, or in solution in water. Salt can be mined from mineral deposits, or extracted from seawater by evaporation. Salt was used to preserve, store and prepare food for centuries.
Most salt for cooking is processed to standard sized crystals sold as table salt. It is the standard presentation of the salt sold in grocery stores for household use in cooking and baking. The crystals are small enough to fit the holes in a salt shaker, and dissolve in water including in the amounts used to mix bread dough in industrial bakeries. Table salt is treated with anti-caking agents. Depending on manufacturer and brand, it may be treated with or without iodine and other chemicals.
Kosher salt is a table salt with slightly larger crystals, and normally not treated with chemicals other than anti-caking ingredients. Sea salt may have crystals of varying sizes, some of which may not dissolve and distribute uniformly during cooking and baking.
Humans became habituated to salt. During the industrialization of food processing, the food industry used salt to mask the changes to the taste of food that was processed in canneries, and began to use salt as flavour enhancer to increase the sales of processed foods.
It was not believed to be harmful until medical research was conducted in the 20th century.
Chemistry, Biology
Salt, at the atomic/molecular level has one atom of sodium (symbol Na) bonded to and one atom of chlorine (symbol Cl), and is chemically described as (NaCL) sodium chloride. Salt crystals dissolve in water. NaCl can be separated by electrolysis. Salt molecules consumed by living organisms are used in metabolism in extracellular fluid and interstitial fluid.
Sodium is an element, an alkaline earth metal in Group 1, in the periodic table. In living organisms, salt is separated into sodium cations (positively charged ions) and chlorine anions. Before industrial food processing manufactured other products made with sodium, humans consumed animals and plants, or salt, to acquire sodium. Most plants consume little salt, but animals, including humans, require sodium. Sodium is a vital nutrient:
Sodium ions play a diverse and important role in many physiological processes, acting to regulate blood volume, blood pressure, osmotic equilibrium and pH.
Sodium is the primary cation in extracellular fluids in animals and humans. Sodium ions pass into cellular fluid by the enzyme in the cell walls known as the sodium-potassium pump. I have not found an explanation for whether or how the sodium ions are separated from the chlorine or other anions/atoms. Humans (and other animals) have taste receptors that detect sodium ions or salt. These receptors also detect the ions of other alkali metals as salty. The sense of taste for salt is not calibrated. Humans can detect that a mouthful of food contains salt but cannot tell how much sodium they consume.
The adequate intake for sodium is 1,200 to 1,500 milligrams per day. On average, people in the United States consume 3,400 milligrams per day, an amount that promotes hypertension. Salt contains about 39.3% sodium by mass; the safe upper limit for sodium is under 1 teaspoon per day. 1 tsp of table salt weighs 5.7 grams, and contains 2,240 mg. of sodium. The food industry resists reducing the use of sodium in the preparation of packaged foods and restaurant meals. It markets some salty items as traditional foods. Its lobbyists and lawyers disputes the harms of salt. The food industry argues that
consumers make informed decisions (the same argument tobacco companies and drug companies used to defend their profit from the sale of addictive products), and
manufacturers have the right to use salt to sell products profitably.
Manufacturers are required to disclose facts to the USDA in the USA, and to disclose facts to persons purchasing packaged foods with a label on the package headed “Nutrition Facts”. Sodium is listed in the Food/Nutrition facts labels in milligrams; (.001 or 1/1000 of a gram). Sodium is also stated in the Food/Nutrition facts labelsas a % of the national recommended daily allowance (usually the USDA RDA) in a stated amount called a serving, as defined by the manufacturer. It is usually given as a volume and often also as a weight measured in grams.
There are regulations in the USA requiring chain restaurants to disclose sodium content on menus and in some instances tag the content with health risk logo that may alert consumers. These regulations are resisted by restaurants and manufacturers, by lobbying, occasional litigation, obscurity, equivocation and evasion. The Canadian CBC Network covered sodium in restaurant food in Canada in its television/streaming program Marketplace‘s episode “Putting takeout to the test: the shocking amount of sodium in some restaurant meals” (Season 50, Episode aired January 6, 2023) – Text for internet article, with link to YouTube video.
I have put sodium content of several food items in a table at the end of this post.
Salt Free Foods
Salt Substitutes
Salt is essential to the preparation of some foods.
Some mineral compounds interact with the salt sensors in the human mouth. Potassium Choride is one such compound. The food manufacturer French’s began to manufacture and distribute a product called NoSalt, now packaged as the Original Sodium Free Salt Subsitute salt. In 2017 the French’s brands were acquired by McCormick & Company. NoSalt is sold by some retail grocery chains and by some specialized internet vendors. By 2024, I was able to find a potassium chloride product called SaltFree marketed by Windsor Salt in Canadian retail. There are other salt substitute products.
Salt Free Prepared Foods
Some manufacturers have produced salt free foods and brought them to market. Some have been abandoned for unknown reasons. Some salt free processed food products are on the market.
In British Columbia, Canada, the Thrifty’s grocery stores (now part of the retail group that manages the Sobeys stores) sold a store brand of no sodium whole wheat bread. It wasn’t good, but it appeared to sell. The store stopped offering it in about 2020.
Becel (an Upfield brand) packaged a low sodium margerine spread for retail distribution and sale in Canada for several years. It disappeared from retail grocery stores on Vancouver Island in British Columbia, Canada and everywhere Upfield did busness, as far as I can tell, in 2019. Becel’s other margerine spreads generally have about 70 mg. of sodium per 2 tsp. of margerine spread. Becel/Upfield does not post Nutrition Facts on the Web (it complies with the law and has Nutition Facts labels on its product tubs and wrappers. Becel/Upfield promotes Becel margerine spreads as healthy plant based oil products. Becel still manufactures a salt free margerine, sold in blocks. It is not spreadable.
Some zero salt products available before 2020 fell victim to supply chain problems or disappeared for retail stores during the pandemic
Salt Sensitivity
The journal Hypertension published Salt Sensitivity of Blood Pressure; A Scientific Statement From the American Heart Association in Volume 68, No. 3 in September 2016 which argued for the existence of a physiological trait by which the blood pressure of some members of the population exhibits changes parallel to changes in salt intake. Physicians in most places do not diagnose salt sensitivity.
Baking
Salt used in baking yeasted or yeast-leaving bread to flavour bread and to affect the formation of gluten. It is a normal ingredient in recipes and formulas for yeasted bread, as I discuss in my post Sodium in Bread.
Baking Soda
Baking soda, also known as sodium bicarbonate is used in baking as a chemical leaving agent. It is also used as an ingredient in manufacturing baking powder. It is not uncommon for baking recipes to use both baking powder and baking soda. Baking soda has some other uses in cooking, and several other uses.
There is a sodium free baking soda substitute called Ener-G Baking Soda Substitute, manufactured by Ener-G Foods Inc., and available online.
Baking Powder
Baking powder is a chemical leavening agent used in baking, made with baking soda. There is a sodium free baking powder substitute called Featherweight, manufactured by Hain Pure Foods, and available online.
Sodium in Food Table
The table below surveys Food Facts data on product labels for several foods that I encounter in local grocery stores. I have a separate table of food products used in baking, including salt, in my post for baking ingredients.
The column headings for the sodium content table lists the items, in groups. The column headings identify the food product, and
the Food/Nutrition Facts “serving” size, normally set by the manufacturer and details as stated by the mfr., in the Food Facts label:
the weight or mass (in grams) of the Unit and/or
the volume (American Tablespoons (“T”) and teaspoons (“t”) , and/or metric in milliters (“ml”)), ;
for some items, a realistic amount (“RA”) used in a recipe;
the sodium (“Na”) in the RA, by weight, in milligrams. If no RA is given, the Na is per serving.
In the hot sauce group, I have chosen the pepper sauces with low sodium, which use 1 teaspoon as a serving size. I have not used the heavily marketed hot sauces (e.g. Frank’s Red Hot) which may use a large serving size.
Food
Serving
RA
Na (mg.)
Condiments & Spreads
Mayonnaise Hellman’s Regular
1 T
98
Mustard (Dijon) Maille
1 t 5 ml
120
Peanut Butter Island Nut Roastery (Sidney BC)
15 g. 1 T
0
Hot Sauce McIlhenny Tabasco
1 t. 5 ml.
35
Hot Sauce Hot Ones Classic
1 t. 5 ml.
20
Salsa (Black Bean & Corn) Fox Valley
28 g. 2 T
35
Salsa (Medium) FrogRanch
32 g. 2 T
40
Salsa (Hot) FrogRanch
32 g. 2 T
40
Salsa Desert Pepper (not available 2024)
2 T 30 ml
4 T
160
Salsa (Medium) Que Pasa
60 g. ¼ cup (4 T)
210
Salsa (hot) Everland Organic
2 T 30 ml
4 T
260
Olives, Spanish Queen (Martini) Mezzeta
2
340
(cucumber) Pickles Bicks Garlic Dill Pickles “50% of the salt …”
60 g. 1 pickle
270
(cucumber) Pickles Bicks Sandwick Slices “tangy dill” slices “50% of the salt …”
30 g. 2 slices
135
“Low Sodium” Tomato Ketchup French’s
1 T. 15 ml.
40
Dry Beans
Cannellini (White Kidney) Everland Organic
28 g.
1 cup 160 g.
14.4
White Kidney Walmart “Great Value”
35 g. ⅕ cup
1 cup 175 g.
0 ?
Romano Walmart “Great Value”
35 g. ⅕ cup
1 cup 175 g.
0 ?
Produce (raw/fresh)
Cabbage, green USDA FoodData Central
100 g.
18
Tomato USDA FoodData Central
123 g. 1 medium
6.2
Tomato, diced USDA FoodData Central
180 g. 1 cup
9
Fruit & Veg, Processed
Tomatoes, Sun-dried Turkish, ready to Eat San Remo
15 g. 3 pieces
314
Tomatoes, Sun-dried in oil Unico
30 g. 5 pieces
300
Tomatoes, canned, diced; no salt added Western Family “Only Goodness”
125 ml 1/2 cup
10
Tomatoes, canned diced, no salt added Unico
125 ml 1/2 cup
5
Soup & Broth
Vegetable Broth No salt added Campbell
250 ml 1 cup
15
Cheese
Velveeta Process Cheez Kraft
30 g. Cube
450
Gouda (Dutch, sold in wedges or wheels) Several brand names
30 g. Cube
320
Emmental (Swiss or French, sold in blocks) Several brand & retailer names
30 g. Cube
varies 30 to 60
Swiss, sliced Castello brand
18 g. 1 slice
60
Swiss, sliced Cracker Barrel brand (a Lactanis brand)
This post was published in 2023 (as part of a longer post), edited to focus on blood pressure and republished in 2025. I became interested in hypertension and sodium in food in 2011 after recovering from a stroke that was attributed to hypertension. I have used a few home blood pressure monitors.
Pressure
Circulation
The noises of the heartbeat, the flow of blood through blood vessels, and the detectable pulse in blood vessels have been known for a very long time. Humans do not have a sense to detect when their blood pressure is not normal or healthy. Medical science, in the 19th and 20th centuries, credited the idea that blood circulated through the body by vessels from and to the heart to William Harvey, in 1628. This theory was accepted as a better idea than the idea of “humours” postulated by classical and medieval Greek, Roman, Arabic, and middle Eastern writers.
Pressure
The measurement of blood pressure was identified by medical and scientific persons at the end of the 19th century. The Wikipedia entry Sphygnomanometer summarizes of the invention and development of devices to measure blood pressure. The entry notes the invention of the mercury column devices (1881) the inflatable brachial cuff (1896), the use of the inventions by Korotkov in medical research, and the adoption by the medical profession of manually inflated devices, the existence of Korotkoff sounds, and the ausculatory method of determining blood pressure. The Wikipedia entry for Blood Pressure noted, as of late 2023, “Blood pressure is one of the vital signs … that healthcare professionals use in evaluating a patient’s health.”
Systolic pressure is the maximum pressure during one heartbeat. Diastolic pressure is the minimum pressure between two heartbeats. The units of measurement are millimeters of mercury (abbreviated mmHg), derived from the original mercury column sphygnomanometer.
Normal?
According to advocacy groups, including the American Heart Association (“AHA”) and medical charities, and members of the health care communities, the normal blood pressure of a “normal healthy” adult is 120 mmHg systolic and 80 mmHg diastolic, written as 120/80 (spoken as “120 over 80”).
The AHA’s online pamphlet Understanding Blood Pressure Readings classifies of 5 bands of BP readings. Hypertension can be described(by the AHA stage 2, above) as a medical condition in which the blood pressure in the arteries is persistently elevated – systolic blood pressure is elevated (>140 mmHg) with a normal diastolic blood pressure. Isolated systolic hypertension may present a health concern. Where elevated readings (>140/>90) appear twice, a medical doctor can diagnose hypertension.
Wikipedia places normal in a range:
Blood pressure is classified by two measurements, the systolic and diastolic pressures, which are the maximum and minimum pressures, respectively. For most adults, normal blood pressure at rest is within the range of 100–130 millimeters mercury (mmHg) systolic and 60–80 mmHg diastolic. For most adults, high blood pressure is present if the resting blood pressure is persistently at or above 130/80 or 140/90 mmHg. … Ambulatory blood pressure monitoring over a 24-hour period appears more accurate than office-based blood pressure measurement.
“… the average blood pressure, age standardized, since 1975 to the present, at approx. 127/79 in men and 122/77 in women, although these average data mask significantly diverging regional trends.”
… in many older people, systolic blood pressure often exceeds the normal adult range”.
Blood pressure is variable, and is affected by physiological, environmental and psychological factors. :
Blood pressure fluctuates from minute to minute and normally shows a circadian rhythm over a 24-hour period, with highest readings in the early morning and evenings and lowest readings at night. Loss of the normal fall in blood pressure at night is associated with a greater future risk of cardiovascular disease and there is evidence that night-time blood pressure is a stronger predictor of cardiovascular events than day-time blood pressure. Blood pressure varies over longer time periods (months to years) and this variability predicts adverse outcomes. Blood pressure also changes in response to temperature, noise, emotional stress, consumption of food or liquid, dietary factors, physical activity, changes in posture (such as standing-up), drugs, and disease. The variability in blood pressure and the better predictive value of ambulatory blood pressure measurements has led some authorities, such as the National Institute for Health and Care Excellence (NICE) in the UK, to advocate for the use of ambulatory blood pressure as the preferred method for diagnosis of hypertension
diet guides and cookbooks. The AHA sells a Low-Salt Cookbook, first published in 1990. The 2011 4th edition is the most modern, and is currently for sale on the internet at the AHA website;
The “non-invasive” methods for the measurement of pressure are: ausculatory and oscillometric. Both methods, as of the late 20th century, measure the air pressure in an airtight bladder contained in inflatable cuffs, held in a fixed position against the body. Since the early 20th century, the flow of blood in a major artery – usually the brachial artery in an upper arm – has been been restricted with an inflatable cuff device. A cuff is wide enough to apply pressure without bruising or injury to the limb, and applied above the elbow. The pressure in the cuff is the measure of blood pressure.
Ausculatory
Ausculatory blood pressure measurement started after the stethoscope and the sphygnomanometer were invented and came into use in the 19th century.. The ausculatory method was a manual method administered by trained professionals – medical doctors and nurses. In the 20th century medical offices, clinics and hospitals were equipped with sphygnomanometers – by the late 20th century, predominantly aneroid devices that displayed pressure on a dial. Aneroid devices are or were regularly calibrated to the ambient air pressure for proper use. The steps of the process:
inflating the cuff while listening to the pulse in the artery with a stethoscope and stopping when the beating was no longer audible,
recording the highest pressure in the cuff as the systolic pressure,
releasing pressure gradually, and
recording the lower pressure in the cuff when the beat resumed as the diastolic pressure.
Oscillometric
Oscillometric blood pressure cuffs and meters work by detecting ans counting oscillations, caused by the pulsing of blood though an artery near the skin while the pressure in the cuff is used to measure blood pressure. Oscillations in the circulatory system were noted in medical literature as early as 1876. The oscillometric method is dependent on the development of transducers and monitors by the electronic industry. The idea of using compressed air in hose to trigger a switch had been used commercially to design devices that could monitor traffic in the 20th century. Automobile service stations used devices made up of a hose, a pressure switch and a bell to alert staff that vehicle had entered the lot and was in a position to purchase gasoline. Such devices are still on the market in the early 21st century to monitor entry to some properties.
The oscillometric method is used in electrically powered automated devices that inflate the cuff, detect when blood flow through the limb has paused, take readings, release the cuff, record and display blood pressure and pulse. It is analogous to a health care worker’s using a stethoscope and an aneroid sphygnomanometer.
The first commercial oscillometric blood pressure monitor was patented in the USA in 1976. With an electronic sensor, this kind of monitor could detect oscillations in the cuff. A sensor could detect the pressure applied by the cuff when the oscillations of the artery in the limb to which the cuff was applied had stopped.
The devices were marketed to, and purchased by hospitals and clinics and became common in those settings by the end of the 20th century. Automated oscillometric monitors are less time consuming for health care providers. Automated oscillometric devices have become the standard. The devices built to professional standards are relatively accurate and reliable.
Some oscillometric devices were acquired by pharmacists and made available for public use. Many pharmacies in Victoria BC and across Canada have them.
Many manufacturers have designed and marketed oscillometric, automated monitors for home use, including self testing.
The authors of a paper in the Journal of Human Hypertension, (available in Springer Nature‘s unlocked service) explains how oscillometric devices work:
… With every arterial pulse wave there is a small rise and fall in the volume of the limb, which in turn causes an increase and then a decrease in the pressure within the encircling cuff, which can be detected using a solid-state transducer. When the cuff encircling a limb is inflated with [a] electronic pump … the rising pressure in the cuff eventually stops arterial blood flowing into the underlying limb and pulsation ceases. This is detected by the machine which continues to inflate the cuff for a second or two more to ensure that the limb flow has stopped completely. At this point, inflation stops, and a valve opens allowing the pressure in the cuff to reduce slowly … The pressure within the cuff is monitored carefully by the machine. At first it only detects the pulseless reduction in pressure. As the pressure in the cuff falls to below the pressure of the peak of the arterial pulse, the machine begins to detect a small pressure wave which reflects the difference between the pressure in the cuff and that in the artery. With further cuff deflation these pressure differences become greater until the cuff begins to fall away from the limb and less of the volume pulsation is detected. The machine therefore records within it a series of pulse waves, which are initially flat, then very slight, then increase to a peak and then diminish until they are hardly detected.
….
Automated oscillometric machines differ with respect to their algorithms, transducers, inflation and deflation rates, cuff sizes and materials, all of which may affect the estimation of BP. These may result in significant differences in estimations of systolic and diastolic BP compared with auscultatory readings in the same patient. Some machines may be accurate in one subject group but not necessarily in others e.g. in obese or pregnant subjects.
Digital meters employ oscillometric measurements and electronic calculations rather than auscultation. They may use manual or automatic inflation, but both types are electronic, easy to operate without training, and can be used in noisy environments. They calculate systolic and diastolic pressures by oscillometric detection, employing either deformable membranes that are measured using differential capacitance, or differential piezoresistance, and they include a microprocessor. They estimate mean arterial blood pressure and measure pulse rate; while systolic and diastolic pressures are obtained less accurately than with manual meters, and calibration is also a concern. Digital oscillometric monitors may not be advisable for some patients, such as those with arteriosclerosis, arrhythmia, preeclampsia, pulsus alternans, and pulsus paradoxus, as their calculations may not be correct for these conditions, and in these cases, an analog sphygmomanometer is preferable when used by a trained person.
Home measurement is not accepted as a basis for medical diagnosis. Home measurement avoids white coat syndrome and inflated reading but the opportunity for prolonged rest can make home readings seem lower than otherwise valid professional measurements. Doctors may ask patients if they have been using home monitors but will not diagnose hypertension or provide advice or prescribe treatment with having measured blood pressure – generally using an automated oscillometric device.
The purposes of using a home monitor:
to allow people detect hypertension before and without an appointment and medical examination,
to allow patients to seek advice, and to provide some evidence of white coat or other circumstance affecting office and clinic reading.
Home use devices deliver acceptably accurate readings, if:
the device is working and operated correctly,
the cuff is applied properly,
the patient has been inactive, is warm and comfortable and seated, sitting with the correct posture.
Acceptance by Doctors
Hospitals, medical clinics and medical offices all have sphygnomanometers. Some offices and clinics have aneroid sphygnomanometers for ausculatory measurement. Automated oscillometric devices have become the standard.
The use of home devices is encouraged by the advocacy/charity Hypertension Canada.
Home blood pressure monitoring (HBPM) can be used in the diagnosis of hypertension, and monitoring on a regular basis should be considered for all hypertensive patients and particularly those with:
Inadequately controlled hypertension
Diabetes mellitus
Chronic kidney disease
Suspected non-adherence
Demonstrated or suspected white coat effect
BP controlled in the office but not at home (masked hypertension) If white coat or masked hypertension is suggested by HBPM, it should be confirmed by repeat HBPM or ABPM before treatment decisions are made.
The pamphlet is supported by a paper published in the professional section of Hypertension Canada’s resources, and in the journal of the Canadian Medical Association (“CMA Journal”), in which the authors write:
Because detection and management of hypertension rely on accurate BP measurement, it is important to use a device that has been validated and confirmed for accuracy. Validated auto- mated oscillometric devices are preferred to auscultatory sphygmomanometers as they are easier to use, less prone to human error and end-digit preference (i.e., where the observer rounds off the last digit), and have better reproducibility. Validation demonstrates relative equivalency between the tested device and rigorously performed manual auscultatory measurements. Globally, only 10% of devices have evidence of validation for accuracy. In Canada, 90% of BP devices sold at pharmacies are validated compared with only 45% of BP devices sold by online retailers. Exceptions where automated devices are inaccurate and manual BP measurement is preferred include in patients with persistent or high burden of arrhythmias, and populations in which an automated device has not been validated (e.g., children and pregnant people, for whom this guideline is not intended). Even when a validated automated device is used, the accuracy of BP measurement may be influenced by many factors. A standardized procedure with proper preparation and positioning, appropriate equipment, and multiple averaged measurements reduces variability.
The authors of the CMA Journal paper outline the general standard of care that physicians must measure blood pressure directly before diagnosing or treating hypertension. The authors make assumptions about the testing of home devices and the validity of readings. The mechanism for automated devices to be validated, and the definition of a validated automated device are not clear.
Hypertension Canada has and has had a program allowing manufacturers to mark the packaging of some home devices with a check mark and the logo of Hypertension Canada. As of 2025, the mark indicated that the products was approved. At one time Hypertension Canada supported Gold and Silver marks. 1“Those with a Gold rating meet the highest and most current international standards, and those with the Silver ratings meet the highest international standards available prior to their most recent updates. (Both Gold and Silver levels are accepted as accurate)”. Hypertension Canada does not say it has tested samples of rated models. Hypertension Canada requires manufacturers seeking approval to say that they have processes that manufacture devices that meet the CSA and IEC standards, which will be noted below.
Some manufacturers attempt to address the issue of uniformity and consistency. Devices from different manufacturers may read and report blood pressure and related facts differently. The differences arise from the way the devices are made and way that users operate the machines.
Basic Features
A home blood pressure measurement device is almost always an automated oscillometric device. A home device has these basic components:
a cuff; with a hose; and
an operating unit containing sensors, controls, processors and an LCD display. Most devices include an electric pump that inflates the cuff. Some devices that require manual inflation with a squeezable bulb.
A patient must install the cuff, take the reading and record the result. The display area of a operating unit has an icon(s) or area that flashes as the cuff inflates, and deflates. When the cuff has been is deflated and the reading is complete the device displays the systolic reading, the diastolic reading, the pulse (in beats per minute), and other data.
Displays
The displays on the operating units are monochrome LCD displays that display icons and numerals. There are icons that flash as the cuff deflates and/or as the pump inflates the cuff and the cuff deflates. Conventionally these are triangles pointing up or down. An icon flashes when a heartbeat or pulse is detected, according the design decisions of the manufacturer Conventionally the icon is heart shaped.
Numerals are displayed digitally. When the cuff is being inflated or deflated, the pressure in the cuff changes every few seconds. When the cuff has been deflated the device displays the systolic pressure, diastolic pressure and beat per minute as counted by the device using its algorithms.
Some devices will display an icon for “irregular heartbeat”. The irregular heart beat icon can be triggered by movement,or when the cuff is not attached properly, or coughs or sneezes.
Most devices will display error codes when the machine fails to generate the expected readings, including codes for”movement error”.
Cuffs
Construction
A cuff is basically a package of fabric. It might be flat, but is flexible and its used after being pulled into a cylindrical shape. The exterior is made of a durable material, which holds an inflatable, airtight, interior bladder. The top of the cuff forms the exterior of the cuff, which is wrapped around a body part – usually the upper arm of an adult. The hose connecting the cuff to the device projects from a fitting on the exterior surface. The fastening device is attached to one end of the cuff also to the exterior of the cuff where the cuff overlaps when the cuff is drawn into a cylinder wrapping the limb. The inflatable cuff is the inner layer of the cuff assembly.
Its outer layer has a fastener sewed into the shell. The hose fitting is on the outside so that it will be on the outside of the cuff as it is inflated.
Some home devices use a flexible internal plastic shell which pulls the cuff into a curve around the limb where the cuff is applied. This makes the cuff easier to fit on an arm, and easier to fasten. The shell places enough pressure on the cuff to ensure the cuff contacts the arm.
Fastening
The adhesive hook and loop fastener system, known as Velcro is used in devices built in and after the late 20th century. The hook fabric and the loop fabric are both on the outside of the cuff. The a short section of hooked fabric is at the end of the loop and press into the longer section of loop fabric to close the cuff and hold it in place to focus the pressure on the limb. It is necessary have the cuff contacting the limb, and to close and fasten the cuff.It is not necessary to pull the cuff tight. The cuff will tighten when it is inflated.
Some cuffs, such as the BIOS Diagnostic Easy-Fit BD41RC cuff 2the cuff does not have a BOA mark and is not held out as a genuine BOA product are assembled into cylinders is secured with devices that use ratcheting dials and wire, like those 3genuine BOA systems are made or licensed by the US firm Boa Technology, Inc. that secure some sporting footwear. It is necessary to press and turn the dial to hold the cuff in contact with the limb and engage the ratcheting mechanism.
Options
Some devices may have a Bluetooth radio to upload data to another device, or other data collection and transmission functions. These features may have value to some users who want to make a more durable record than the limited memory space of the monitor device. However it is unlikely that users will be able to send reading from home devices to medical professionals, who normally would not spend time going through that data or want to store it.
Retail Market
Home monitors are sold as retail consumer products, without prescriptions in the retail sections of pharmacies’ (UK “chemists’) or “drug stores'”. In Victoria, British Columbia, many such stores are part of retail store chains. The chains include London Drugs, Shoppers Drug Mart, Pharmasave, and Rexall. Chain stores and other retain drug stores acquire monitors from wholesale distributors.
The brands available include national and international brands and store brands.
There a many firms manufacturing and marketing home devices, including :
Omron – the Japanese firm Omron based in Mukō, a city in the Kyoto urban area in the Kyoto prefecture in Japan, manufactured in Vietnam;
Thermor Limited (a company incorporated in Canada, based in Newmarket, Ontario. Ffor blood pressure monitors and medical electronics. Thermor uses BIOS in the brands BIOS Medical, BIOS Diagnostic. Thermor uses a BIOS brand for BIOS Weather, for thermometers and hygrometers. Thermor also manufactures devices sold as store brands by retail chains – for instance Be Better, a store brand sold in Rexall pharmacies in Canada. Thermor was founded as Taylor Instrument Companies of Canada, founded in Toronto,. Ontario before 1939, (4not to be confused with other brands, companies or business names named “Taylor” including the modern USA firms (1) Taylor Technologies associated with maintaining swimming pools, or (2) Taylor USA, which distributes scales, thermometers and other measuring devices. The BIOS web presence of Thermor is at the BIOS Medical site. Most Thermor devices, including BIOS brand blood pressure monitors, are manufactured in China.
Standards
Regulatory & Product Rating
The Canadian federal government and provincial governments do not legislate how home monitors are supposed to be built. The Canadian federal department of health has a list of approved standards, including standards for electromedical devices, a requires persons operating some facilities to hold federal licences. The standards are those of national and international agencies including the Canadian Standards Group (CSA), and the International Electrotechnical Commission (IEC). Many CSA standards are republications of IEC standards. Standard 60601-1, and amendments, addresses General requirements for basic safety and essential performance of electrical medical equipment.
Manufacturer Manuals
The manufacturers of home devices distributed in Canada provide instructions to users in manuals on:
attaching the cuff,
posture during readings, and
the operation of devices.
A manual will suggest the cuff be applied to upper part of the left arm at a distance above the elbow, usually with the inflation tube aligned to the inside of the limb. It may suggest a different place and alignment on the right arm.
A manual will advise taking readings in a quiet place, at the same time, keeping warm, avoiding stress and not taking readings for at least 30 minutes after bathing, consuming alcohol or caffeine, smoking or exercising.
Similar advice can also be found in resources like the Canadian advocacy entity Hypertension Canada’s pamphlet for professionals.
Manuals may contain implicit disclaimers about the precision of readings. The manual for the BIOS BD410, a home use device made by Thermor Limited, says: “1.2C Many questions arise when two blood pressure devices are compared in an effort to check accuracy. ….”
Monitors distributed in Canada also declare or assert a margin of error in the pressure readings under technical specifications in the manuals packed with the monitors. Examples:
Brand
Model
Term
BIOS
BD410
static accuracy
± 3 mm Hg
Omron
BP7350CAN
accuracy
± 3 mm Hg
Electrical interference
The manuals of many devices address electrical interference. Examples of the text used are noted here.
The Omron “7 Series Upper Arm Blood Pressure Monitor” manual recites:
DO NOT use use this monitor in areas containing high frequency surgical equipment, magnetic resonance imaging equipment, computerized tomography scanners. This may result in incorrect operation of the monitor and/or cause an inaccurate reading.
….
During measurement, make sure that no mobile device or any other electrical device that emits electromagnetic fields is within 12 inches (30 cm) of this monitor. This may result in incorrect operation of the monitor and/or cause an inaccurate reading.
The BIOS BD410 manual recites:
“1.2B
….
Using the unit in the immediate vicinity of mobile phones, microwave appliances or other devices with strong electromagnetic fields may result in impaired functioning.”
These samples do not explain what state a mobile phone should be in or which services and device radios enabled (airplane mode, cellular radio, wifi radio, bluetooth radio on or off, or totally off). They do not mention proximity to a wifi router. They do not discuss which appliances have electromagnetic fields. Does a dehumidifier (a device with cooling coils like a refrigerator or air conditioner) have an electromagnetic field?
In Canada, in 2025, there is an issue about Bick’s “pickles”.
Pickling is a method of food preservation and storage by storing food in a liquid. The Wikipedia entry pickling discusses two methods that use liquids that are acidic or high in salt, or both that liquids inhibit most microscopic organisms. The liquids are known:
In Canada, like the USA, pickles means, basically, pickled cucumbers. Cucumbers, the major ingredient, are fermented by lactobacillus bacteria and immersed in vinegar and water. Pickles can be made with household equipment in modern kitchens or by industrial methods. Industrial manufacturers will be more likely to inoculate the cucumbers with a cultivated strain of bacteria to keep the product standard. The fluid is brined with salt, and other dry ingredients added to the fluid: spices and other ingredients (e.g. dill seeds, or flowers).
The cucumbers absorb salt from the brine as they turn into pickles. This normally results in daily percentage rating of over 15% sodium in the nutritional (“Food Facts”) label on the pickle jar – i.e. “a lot”. Most pickles are “fully” fermented. Not as salty = lower sodium. Pickles have been a salty product for decades, partly because of the method of production, partly by tradition, and partly by consumer preference.
Bick’s and Canadian Tariffs
Bick’s is a brand with a large market share in the markets for pickles –
Canadian grocery retail stores, and
the wholesale market.
The business of making pickles and the Bick’s brand were owned by a company founded by Canadians and operated in Canada. The company was sold to Kraft Foods Canada in 1966. The buyer was or became the Canadian subsidiary of an American conglomerate. The Bick’s brand and business were owned by the American conglomerates J.M Smucker 2004-2024 and Treehouse Foods since 2024. Wikipedia notes “Since 2011, Bick’s products are imported from the United States and marketed by the company’s Markham, Ontario, based head office.” The labels on containers of Bick’s brand pickles, as of late August 2025, identify the contents as a product of the USA.
The retail chains in the Canadian grocery market are mainly owned by Canadian capital interests. The West0n/Loblaw and Sobey chains have store brands of pickles. There are competing pickle brands and food product brands that include pickles- e.g. Western Family.
When the US government began to levy tariffs on goods imported from countries outside the US in 2025, Canada levied counter-tariffs on goods. By August 10, 2025 Safeway stores (part of the Sobeys chain) in Edmonton Alberta did not have Bick’s pickles available for sale. The CBC reported:
At several Safeway grocery stores in Edmonton, a sign on the shelf reads “Bick’s pickles are currently unavailable as an unfortunate impact of tariffs. We are pleased to offer a selection of alternatives for your shopping convenience.”
Safeway did not want to pay the tariff or increase the price of Bick’s pickles to pass the counter-tariff on to consumers. The mechanism of taking the product off of store shelves was not clear. Bick’s CEO Steven Oakland made statements when approached by the media:
“I think a lot of retailers feel that 25 per cent tariff makes them just too expensive frankly,” Oakland said, adding that retailers started reaching out to him with cost concerns at the start of the trade war.
“The food business is a low-margin, high-volume business. And so there isn’t 25 per cent either on the retailer side or the manufacturing side. So that has, in some cases, really inhibited the retailers’ availability to justify carrying them.”
Oakland estimates that Bick’s is still available in 70 per cent of the Canadian retail environment but said the company has been doing outreach to try and change the Canadian counter tariff, including reaching out to the governor of Illinois.
….
While the pickles are assembled in Green Bay, Wis., Oakland said the company buys 11 million pounds of Ontario cucumbers every year and said all the lids on the jars come from an Ontario manufacturer.
….
Bick’s began as a Canadian company, but Oakland says it was later acquired by a U.S. company and production was moved south of the border around 2014.
….
“We continued to prioritize Canadian cucumbers for that product. [It’s] why we went to a Canadian lid supplier…. It’s just been an intertwined business and now we’ve got a border dispute that just makes that transfer back and forth across the border expensive,” he said.
Bick’s pickles are made by putting raw cucumbers in brine in a plant in Green Bay, Wisconsin. The fact that Bick’s buys cucumbers grown in Canada by Canadian farmers doesn’t change how or where cucumbers become pickles. The cucumbers were substantially transformed when they were processed in the USA. Bick’s did not mark the pickles as “made in Canada” or “product of Canada”. The terms are defined in a Canadian law, which interpreted and explained by the Canadian Food Inspection Agency.
Made in Canada
When a food undergoes processing which changes its nature and becomes a new product bearing a new name commonly understood by the consumer, (for example, salad, pot pie, sausage, pizza, beer), it is considered to have undergone substantial transformation.
“All or virtually all” means that all the significant ingredients in a food product are Canadian in origin and that non-Canadian material is negligible in the food. Ingredients in a food that are present at very low levels and that are not generally produced in Canada, including spices, food additives, vitamins, minerals, and flavouring preparations, may be used without disqualifying the food from making a Product of Canada claim. Foods such as oranges, cane sugar, and coffee, which are not grown in Canada, may be considered minor ingredients when present in low amounts. Generally, the percentage referred to as “very little” or “minor” is considered to be less than 2% of the product.
Cucumbers, some Canadian in origin, are transformed into pickles when brined in the USA. The cucumbers are not further transformed by being sent and billed to retail chains.
Bick’s pickles were still on the shelves in many retail grocery stores in Victoria, BC in late August 2025. Thrifty Foods, the Sobey company in BC still had some.
On August 22, 2025 the Prime Minister of Canada announced that counter-tariffs would not apply to goods imported from the USA exempted under the 2020 United States–Mexico–Canada Agreement after September 1, 2025.
Will Trump threaten to make Canadians pay more for
access to the US markets, or
buying products produced by American businesses?
He says he can do both, at the same time. The MAGA edition of trickle-down economics with tariffs, isolation from the rest of the world, and exciting new policies like the use of the military to control America.
Less Sodium
For a couple of years I bought “50% the salt of our regular pickles” Bick’s pickles – usually “50% the salt of regular” Bick’s garlic dill pickles. The nutritional labels for whole garlic dill pickles identified a serving as one piece (1 pickle?), weighing 41 grams (1.6 US ounces). Whole dill pickles are not all exactly the same size. The stated sodium content for one serving, regular salt, is 368 milligrams. The half salt version is 170 milligrams. The half the salt product was available for garlic dill “Sandwich Slicers”. 1 serving of garlic dill sandwich slicers is identified as 2 slices, weighing 33 grams (1.2 ounces), with 135 milligrams of sodium.
There are pickles on the market lower in sodium than Bick’s and other American style pickles. Pacific West Imports Group Ltd., an entity established in Canada, (head office in Victoria), trading as Euro Goods, markets Polish Dill Pickles processed in Poland. The nutritional label on the label of a 900 milliliter jar identifes 1 serving as 100 grams. The sodium content in a 100 gram serving is 320 milligrams. The comparison in terms of 41 gram servings:
Euro Good Polish dill
Bick’s “half the salt” garlic dill
131 milligrams sodium
170 milligrams sodium
The Polish dill is, perhaps, not brined as long as an American garlic dill, and is flavoured with different spices. Nearly the same price as Bick’s dills.
Made in a Central European country that has good relations with Canada, tasty, low sodium.
This post was first published in 2022 and revised and republished in 2025.
2022 – Pan Replacement
Drive Shafts
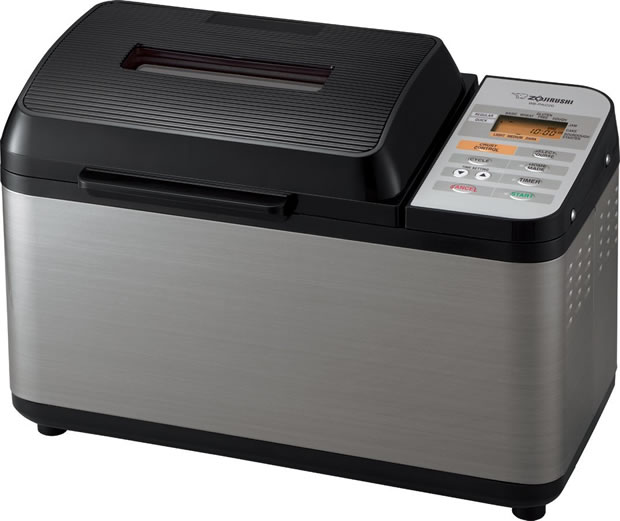
My Zojirushi Virtuoso (model BB-PAC20) bread machine, purchased in 2020, stopped working on June 27, 2022. The pan would not seat on the drive connectors in the base of the machine. One of the 2 drive shafts was seized. The drive shafts are attached to the pan, a manufactured assembly of parts. There was no way for me:
to remove the shaft, the bearing and the seals, or
to have the pan serviced and the shaft and bearings serviced or replaced anywhere in North America, or indeed, the world.
A user can try to replace a bread machine pan, if the manufacturer is still supplying replacement pans to its sales and service agents. Zojirushi’s machines are not unique in this respect.
The pan was already loaded with unmixed ingredients. I emptied the pan into a mixing bowl. I mixed the ingredients, kneaded the dough, and baked the dough in the oven. I set the oven to 350 ℉. I guessed time, and kept baking until the loaf was done. It had not risen properly, but it was edible.
Replacing the Pan
Zojirushi sells its branded bread machines through select retailers. On Vancouver Island, the retail distributor was Healthy Kitchens, an e-commerce store in or near Duncan BC, the successor of a retail store in Cowichan Bay or in Duncan – not far from Victoria. In 2022, the online store advertised the newer Zojirushi Virtuoso Plus, model BB-PDC20, and a replacement pan for the BB-PDC20. It did not list a replacement pan for a BB-PAC20 as available. In 2022 Zojirushi’s Canadian service/parts agency, Beaver Creek Electronics, in Richmond Hill, Ontario (in the Greater Toronto area) was selling replacement parts online and arranging delivery. It had:
8-BBP-P080 pan assemblies for the BB-PAC20 Virtuoso,
BX167810A-00 pan assemblies for the BB-PDC20 Virtuoso Plus (“V+), and
kneading blades (Zojirushi’s term for the paddles or dough hooks in the pans) for both the BB-PAC20 Virtuoso and the BB-PDC20 V+.
Both pans are the large horizontal pans that will hold and bake a 2 pound loaf. The pans look the same. The differences are subtle – the dimensions of the drive shafts attached to the base of the pan. There was nothing from Zojirushi to say that the BX167810A-00 pan assembly could be a replacement part for the older Virtuoso. I ordered the 8-BBP-P080 pan assembly (for the BB-PAC20) from Beaver Creek in Richmond Hill. It arrived July 5, 2022. I did not order new kneading blades at that time.
It would have been better to order a BX167810A-00 (V+) pan assembly, and a set of kneading blades manufactured as replacement blades for a BB-PDC20 V+.
I discovered in 2025 that the pan assembly for the V+ fits in a Virtuoso. This was suggested in the description of the pan on an American dealer’s web site. The main difference between the pan assemblies was how the drive shafts fit the kneading blades.
Kneading blades have a limited service life, and should be replaced after 100 weeks of service of 1.5 to 2 loaves a week.
2025 – kneading blade failure
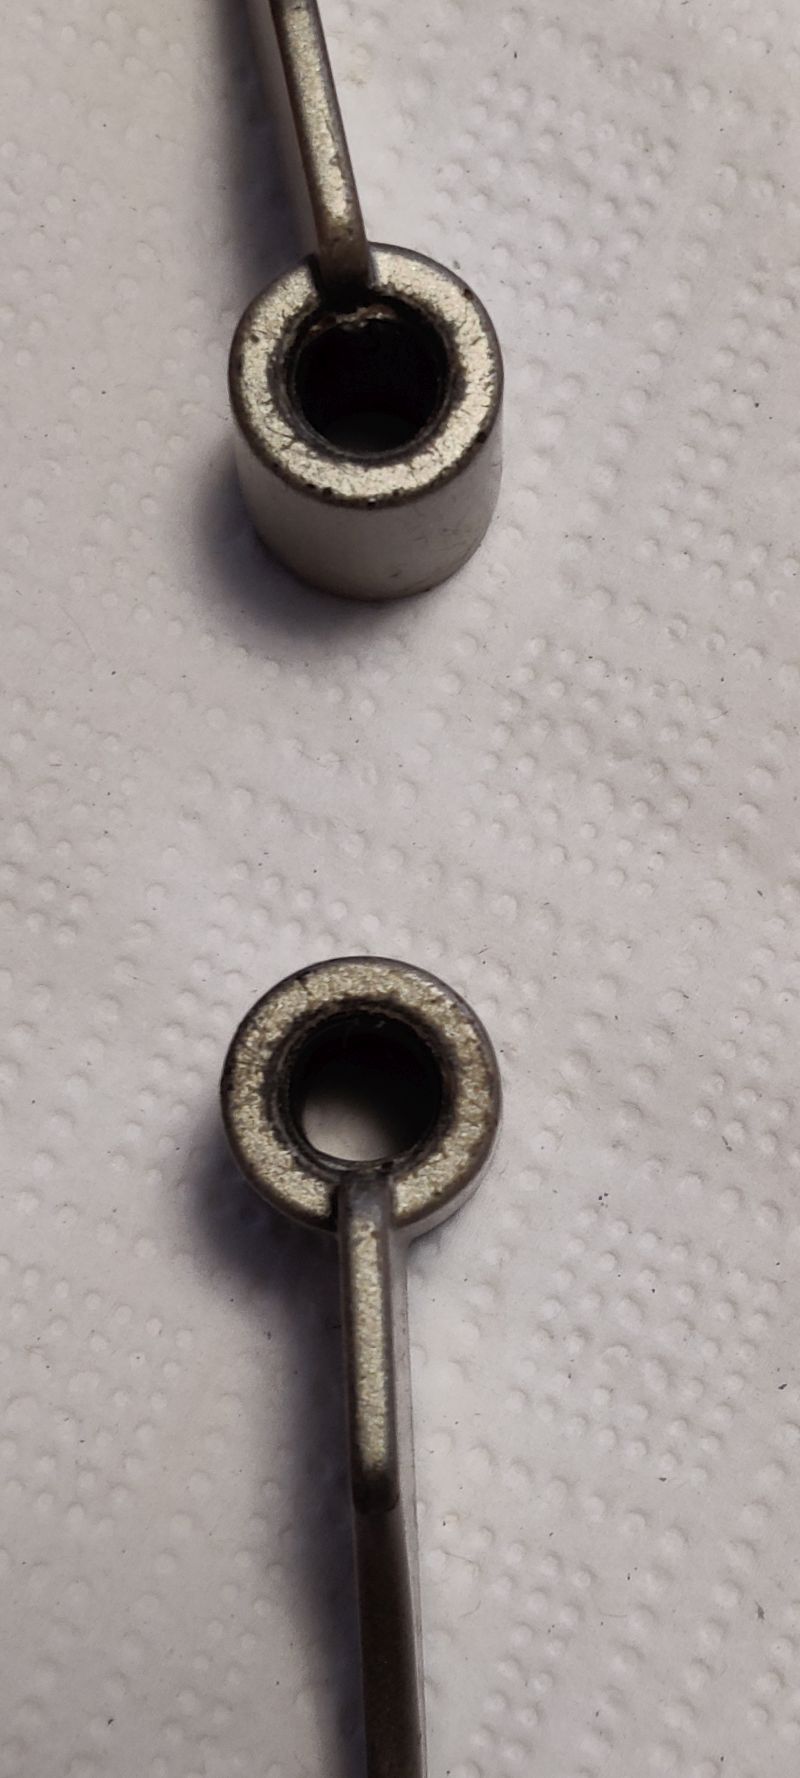
One of the my original Virtuoso blades failed in July 2025. The result and sign of the failure was that there was some dry flour in a pocket in the loaf at one end, when the machine stopped after the loaf had been baked. The machine had run. The machine had mixed most of the ingredients, kneaded dough and baked the loaf. The drive shaft had not moved the blade on the drive shaft at the end of loaf where I found the flour.
Upon a very close inspection, the flat area of the socket of one of the blades had disappeared, leaving a rounded socket that did not fit the drive shaft and did not rotate with the drive shaft. I took this picture. The blade at the top of the image is worn but still only points away from the flat portion of the drive shaft. The blade at the bottom of the image, completely worn, can be rotated around the shaft.
Another picture of my old blades . The blade that still works is at the top. There is still material visible in the socket to form a functional flat section. of the shaft. There is nothing left of the flat section of the socket of blade at the bottom:
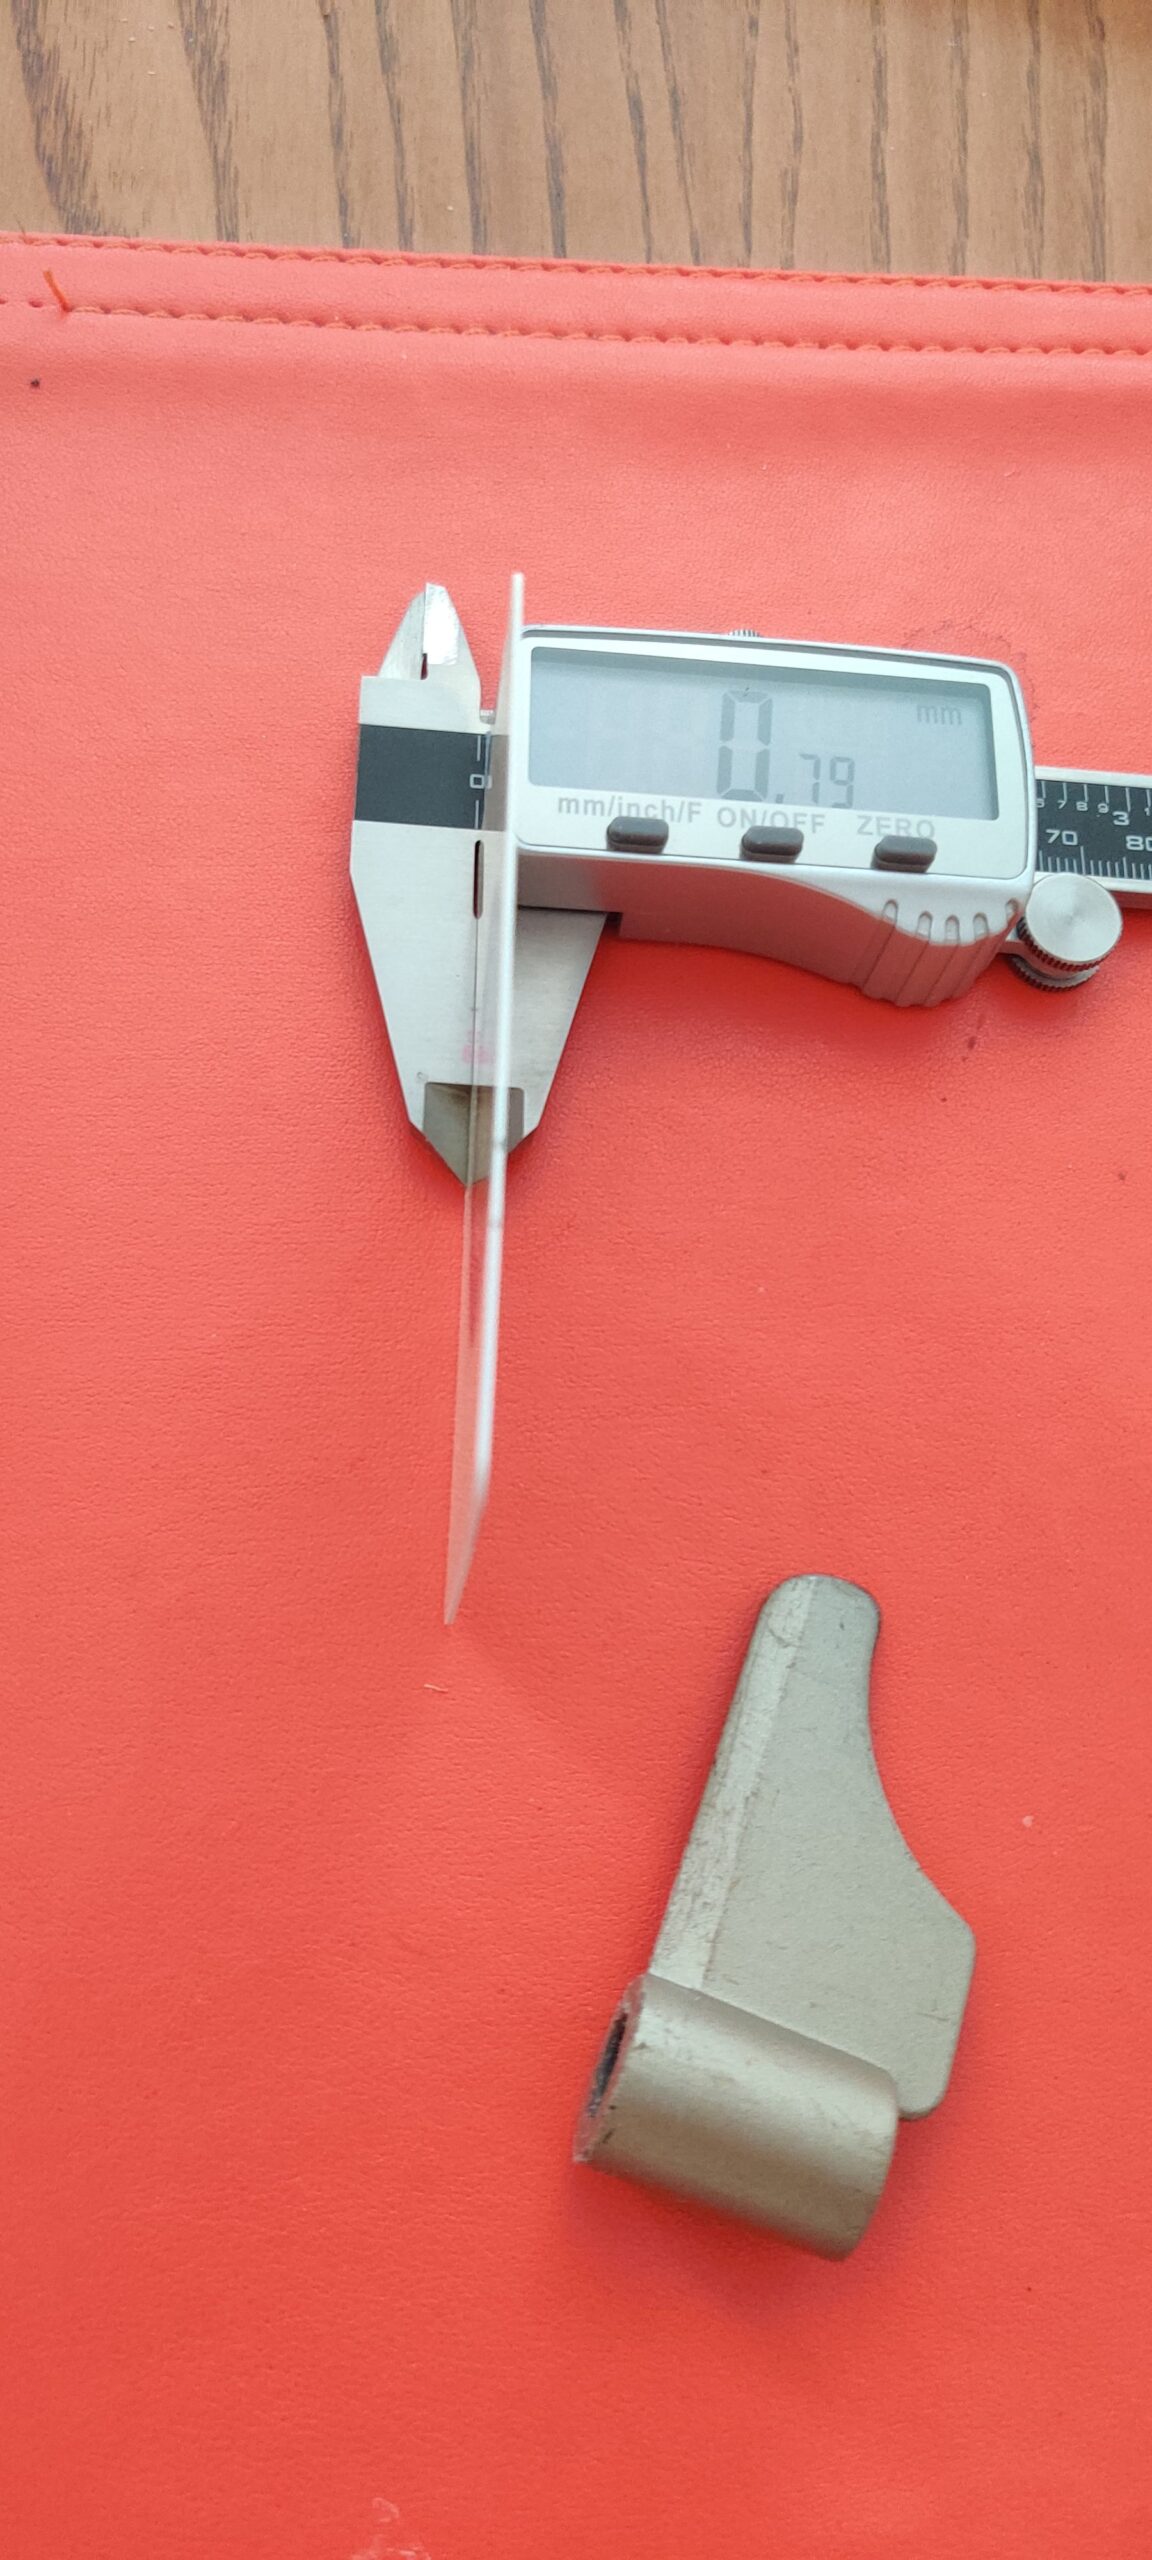
The flat section of the socket of the blade is only about 3 mm. long. It does not run the full height of the socket.
No Blades
By 2025, there were no replacement blades for the Virtuoso BB-PAC20 available from any vendor in Canada or the USA. True replacement blades would be made of the same metal as original manufacturer’s blades, with the manufacturer’s no-stick coating.
Compatible Blades
There was a listing in the Amazon.ca market for “LEDBarz 8-BBP-P070 Bread Machine Kneading Paddle(2Pcs) Compatible with Zojirushi Bread Machine BB-PAC20”. The listing said “It is recommended to apply some cooking oil to the kneading paddle before use to enhance your baking experience, this is a top of the range replacement part that is compatible with Zojirushi bread machines such as the BB-PAC20 model”. The vendor was a “brand” which offer several other small parts for various device – evidently all shipped from China. It had negative or lukewarm reviews:
The new paddles for my Zojirushi fit but they do not have a non stick coating so consequently when removing the bread from the pan, big chunks of bread stay behind, stuck to the paddles. Very disappointing.
xxxx
They’re lacking a non-stick coating of any kind and are just highly polished instead, which means there’s a tendency for them to take divots out of the bread as it bakes very firmly onto them. But even the original paddles sometimes did that, so they’re a perfectly adequate substitute.
The LEDBarz blades fit on the drive shafts, but they:
are made of different material that the original authentic blades. (A blade weighs about 30 grams);
lack any no-stick coating.
The manufacturer’s advice to coat the blades with cooking oil was dubious – a few drops of oil would be absorbed like oil added as as ingredient, as the machine mixed and kneaded. I tested whether the blades, coated, would work when used when dough is not mixed in the pan and is placed in the pan to rise and bake. Under those conditions, the dough baked onto the blades, which tore holes in the loaf.
I tried using the machine simply as a proofing box and oven would work, if the shafts were coated with cooking oil. The dough must have absorbed the oil on the shafts as the dough rose. Some crumb baked onto the shafts, leaving the shafts coated in crumb and leaving small conical holes. Much better, but I was using time mixing and kneading, and not getting those functions from my Virtuoso machine.
I tried to “season” the blades by heading them, coating them with flax oil and baking the oil. This is the way to season cast iron griddles and frying pans and carbon steel woks. The oil baked onto the blades, but this did not alleviate the adhesion of dough, and the result that bread baked onto these blades.
I bought a V+ pan assembly and a set of V+ kneading blades. Not cheap, but this worked to mix, knead, rises and bake and to get loaves out of the pan without leaving those divots on the blades.
2022-25, Bread Machine
Loading the Bread Machine
The Zojirushi machines take fluids first, at the bottom of the pan. The “Operating Instruction & Recipes” booklet by Zojirushi USA, with the machine when I received it says: “Precisely measure the ingredients and add them to the baking pan in the following order … :
Water (liquid)
Flour – make a mound of flour
Sugar, dry milk, salt and butter
Make a depression in the middle of the flour and place the yeast”
The booklet did not say or suggest that this order saved the kneading blades or any component from any risk of damage.
I routinely loaded ingredients that dissolve or suspend in water in the liquid before the flour: salt, sugar, honey, molasses, maple syrup, milk, milk powder and butter.
I began to use table salt instead of kosher salt, which I used before 2022. As I have been measuring by weight, this has not made a difference in results. Kosher salt has larger crystals and can be used to replace table salt when measured by weight. Both kinds of crystals are small enough that they dissolve in water during the rest and mix/knead phases in a bread machine.
Bread machine manuals warn against using the time feature for a delayed-start timer with milk products, because of the risk of spoilage. I rarely set the timer on my bread machine.
Recipes
I stopped trying to put recipes online. I put my recipes into spread sheets that showed ingredients by weight and volume, and allowed for calculation of Bakers’ ratio, sodium content, and other details. This has allowed me to work on how much salt to use to get acceptable gluten development, and how much yeast and water are necessary to get a dough that flows, rise and springs without ballooning, collapsing or developing a dimpled or cratered top crust.
Vital Wheat Gluten
Before the pandemic, it was possible to buy vital wheat gluten (“VWG”) in grocery stores in Victoria. Some stores stocked a brand milled by Millstream Natural Foods. Others stocked Bob’s Red Mill brand Vital Wheat Gluten. I was not able to find Millstream in retail stores or online. That supplier may have ceased offering it. Bob’s stopped offering the product under that name and ny 2022 offered “Gluten Flour” which is its new name for VWG. For a few months neither version of the product was in stores in Victoria. VWG is still being milled, and marketed the Market Stores in Victoria as of 2025, but not Loblaws, Save-On, Walmart or any other grocery store chain. People who have bread machines or who bake certain recipes at home may need it. But, there is a movement against gluten which may be making decision makers nervous that stocking the product harms the brand reputation of the company
Proofing Box Feature
The Zojirushi Virtuoso and V+ models uses the heating element to bake the ingredients, and also to:
warm the cold ingredients in a period of “rest” before the machine mixes and kneads the dough, and
raise the temperature in the pan to 91-95 °F (33-35 ºC) in the “rise” periods before baking when the yeast is fermenting the dough producing gas that inflated the dough.
This effect can be compared to using a proofing box. a device to keep dough warmer than room temperature (during primary fermentation or proofing)
None of the bread machines on the market surveyed by Beth Hensperger in her Bread Lover’s Bread Machine Cookbook (2000) were said to have worked that way. The machines on the market at that time had timers setting the “rest” times. The dough was warm and moist after kneading (the action of kneading makes dough warm). The machine kept the heat and humidity by shelter inside the pan in the machine under a lid. The possibility of heating the unmixed ingredients and dough was not mentioned in that book. The development of a proofing box function involved different control chips and switches. It is a feature on the Zojirushi Virtuoso, the V+, the Zojirushi Supreme and some other Zojirushi machines. I think it was a feature on my Panasonic, although it was/is not discussed in the Panasonic material. I don’t know if a heated “rest” or “rise” phase has become common or standard in the industry or the market. I haven’t researched this.
Timed warm fermentation is a feature when that aids the machine to produce a predictable loaf in the set time. Artisan bakers extend and delay fermentation by mixing pre-ferments, and by refrigerating pre-ferments and doughs.
Oven Baking
Effort and Costs
I had not hand mixed and kneaded, used my stand mixer or made no-knead bread 0ften since I began to make bread in a bread machine. The bread machine makes good sandwich bread, if I get the flour, water, salt and yeast right. The bread machine and pan do not require the cleaning that mixing bowls and tools require.
I had, at one time, a stand mixer with a 7 quart bowl. I did not use it much and sold or donated it a few years ago. A stand mixer is a specialty appliance. Its main job is mixing and kneading bread dough.
I have a Bosch Compact stand mixer. Like other Bosch mixers, it is a multi-function device that powers a food processor, a blender and other powered accessories. It is smaller than most other stand mixers made for American consumers. It has a 4 quart bowl, big enough to mix and knead dough with 8 cups of flour – enough for two 9 inch x 5 inch loaves baked in oven baking pans. The motor is rated at 400 watts. Bosch’s larger (6.5 quart bowl, 18 cups flour capability) Universal stand mixer has been down graded by American Underwriters Laboratory from 800 watts to 500 watts.
A stand mixer reduces some of the labor of mixing and kneading, and the effort of cleaning up bowls, utensils and working space, but not as much labor as bread machine.
Oven baking
The first hot spell in 2022 ended the day the bread machine broke, but it was followed by other hot days. I only tried a few oven loaves on cool days. I found the dough rose slowly, and did not rise after I had put dough in bread pans for secondary proofing (final fermentation). I wondered about possible causes:
my low yeast/low salt approach,
my kitchen was to cool those days,
I was not giving the dough time, and/or
I handled the dough roughly.
There were several more hot days in August and early September 2025. I avoided oven baking. I thought I would experiment in the fall and winter. But I did not follow up until 2025. In 2025 I grew a mother starter (a culture of yeast and bacteria grown without using modern industrially grown baker’s yeast) and made some dough with sponges and starters made from the mother starter.
Sodium
Less is better
Baked bread, sold in stores and bakeries, is high in sodium due to the amount of salt used in baking, and sodium in some other baking ingredients including baking soda, baking powder, milk and powdered milk. Home baked bread is high in sodium due to the amount of salt in most recipes in books or on line. Bread machine bread, made with standard recipes, is high in sodium. For instance, a 1.5 lb. medium bread machine recipe for lean white (“French”) bread or for white sandwich bread may specify 1.5 tsp. salt and 2 tsp. instant yeast (the yeast may be similar to 2.75 tsp of active dry yeast). Both require 417 g. bread flour (3 cups). The water requirements will be different, but in a range from 237 g. (1 cup) to 1.5 cups.
Sodium is a micronutrient, but a healthy adult only needs 500 mg. daily.
1.5 tsp of salt is 8.5 g. This amount will contribute 3,360 mg. of sodium to a loaf. 1 moderately thick slice from that loaf will contain about 300 mg of sodium. Assuming 16 slices per loaf and 2 slices per sandwich, a sandwich will contain 400 mg. of sodium. While that sounds ok, 4 sandwiches in a day means 1600 mg. before counting any sodium from any other food. This makes it hard to restrict sodium consumption to the daily limits advised by agencies or or follow a DASH diet with sodium limitation. Agencies and recommendations:
the USDA – 2,300 mg.,
the WHO – 1,500 mg..
A 1.5 lb. medium bread machine recipe
for a multigrain loaf with bread flour and whole wheat flour may also specify 1.5 tsp salt but the yeast may be higher than 2 tsp. instant yeast. The water and water based fluid will be higher.
for a pure whole wheat loaf may specify 1.5 tsp. salt and 3 tsp. (1 Tbsp.) instant yeast. It may specify more than 3 cups of flour and 1.5 cups of water.
Each recipe may require or suggest a different program, and the mixing/kneading programs vary between machine brands and models. The set time for mixing/kneading, primary fermentation, bench rise and baking vary.
I have made bread with 50%, 33% and 25% of the salt in a standard recipe bread a few changes in crumb and the taste of the bread.
There are a few recipes for no-salt bread and no-salt bread machine bread online and in specialized recipe books.
I tried recipes from the Zojirushi Virtuoso Operating Instruction & Recipes booklet:
a medium bread machine loaf that uses equal portions of whole wheat flour and bread flour, which I adjusted to less than 1¼ tsp. active dry yeast for a 2 lb. large loaf, scaled down to a medium loaf1converted to instant yeast, and metric weight 3 g.;
a medium bread machine loaf that uses bread flour zero salt, and 1 Tbsp. of vinegar, and 2.16 g. (75 tsp.) instant yeast.
These low salt and zero-salt loaves worked. The results contradict the rule of thumb I have been following for reducing salt and yeast, and started a process of developing numbers for workable weights of yeast and salt for Virtuoso machines.
Instant yeast
I used SAF Red instant (dry)yeast until I had used up a 454 g. (1 lb.) bag in 2021. I had tried to weigh and average 1 tsp. samples. I thought 1 tsp. SAF Red instant yeast weighed 2.8 g., but sources said the standard for instant yeast was 3.12 or 3.15 g. I purchased a small bag of instant yeast (Red Barn stores brand) locally. It appeared to weigh 3.2 g. per tsp. I ordered another bag of SAF Red and tried to verify what 1 tsp. weighed to check on my recipes.
King Arthur or its shipping contractor stopped shipping to Canada in 2023, and Red Barn stopped packaging and selling instant yeast. I found that Fleischmann’s make a product called IDY, an instant dry yeast, in 454 gram (1 lb.) bulk foil bags, available locally in Victoria. It works fine. In retail grocery stores in 2025, yeast, including yeast by Fleischmann’s is still marketed in glass bottles or very small (less than 1 Tablespoon) foil packets, labelled as active dry yeast, fast rise yeast, or bread machine yeast. Such is the belief of yeast growers and marketers in the value of names to sell things.
Reduction formula
A rule suggested by Beth Hensperger in the Bread Lover’s Bread Machine Cookbook (“BLBMC”), is to reduce salt and yeast proportionately by weight is a rule of thumb. It works with wheat flour (bread flour and whole wheat flour) loave). There must be yeast or a leavening agent to make a dough that rises and can be baked into leavened bread. It is a good idea to have some salt. Salt affects hydration and gluten formation (a reaction between two proteins found in wheat flour). The amount of salt in most recipes is higher than what is necessary for gluten formation.
Following the BLBMC rule starts to produce loaves that do not flow and rise enough – the dough is not fermenting enough or is losing gas. I have reconsidered my approach to how much yeast and water to use to balance medium loaves.
I wrote and published this post in 2020 within a few months after I started using a Zojirushi Virtuoso bread machine. I made changes and reorganized. I made major changes and republished in 2025.
Zojirushi Virtuoso
The firm has a brief Wikipedia entry, which reports:
Zōjirushi Mahōbin Kabushiki-gaisha) is a Japanese multinational manufacturer and marketer of vacuum flasks, beverage dispensers, thermos-style lunch jars, and consumer electronics including rice cookers, electric water boilers, hot plates, bread machines, electric kettles, and hot water dispensers.
There are subsidiary or related companies in the People’s Republic of China, Hong Kong, Taiwan, Korea, Thailand and the USA. Zojirushi has Australian, Middle Eastern and European distributors. The global web page only list the USA company in the North America section. The two main Zojirushi web sites:
the global (international) web page. It displays in the English language. The global page does not mention bread machines.
the web page Zojirushi.com. The domain is controlled by the USA company, which publishes the .com page. This page is a portal to the USA web store. These pages and the web store discuss Zojirushi bread machines.
The relative authority and roles of the regions and regional companies are not stated. Zojirushi web pages do not say where Zojirushi products are manufactured. One third party site says, as to bread machines:
The company has several production sites, including its main factory in Osaka, Japan, where it produces a significant portion of its bread makers. Zojirushi also has partnerships with contract manufacturers in countries such as China and Thailand, where some of its products are assembled and tested.
TableAndSpoon, viewed July 21, 2025
Another third party site says:
Zojirushi is a Japanese company that produces a wide range of kitchen appliances, including bread machines. Zojirushi bread machines are designed and engineered in Japan, and the company’s manufacturing facilities are located in Japan, China, and Thailand.
The exact location of production may vary depending on the specific model and the year it was manufactured. …
The model BB-PAC20 was apparently the original Virtuoso.
The Bread Machine Diva (see links below) said in a post on her web page/blog “I bought [a BB-PAC20 Virtuoso bread machine] in 2013 and it’s still going strong. Yes, it’s more than 10 years old! I love love this bread machine! I make bread in it all the time and this machine has lasted longer than any bread machine I’ve ever owned.” The post has had undated changes and updates. She said she had replaced the kneading blades a few times which qualifies her statement about durability.
Reviews online that described and illustrated the Virtuoso BB-PAC20:
Breadmakers.com. As of 2025 site had been updated to discuss the V+.
the Bread Machine Diva site has material on Zojirushi’s BB-PAC20 Virtuoso, BB-PDC20 Virtuoso Plus (“V+”), and BB-CEC20 Supreme (“Supreme”), as well as recipes.
The Bread Machine Diva site had resources, as of 2025, that may assist users of many machines – e.g. a page of links to manufacturer service sites and manuals.
By 2019, Zojirushi was marketing the BB-PDC20 Virtuoso Plus (“V+”, and had stopped producing the Virtuoso.
The V+ is structurally and functionally similar to the Virtuoso. There were changes to the keypad and the courses (Zojirushi calls the programs that control the machine in kneading and baking a specific type of loaf”courses”. Courses are options turned on by touching buttons on the key pad. Other manufacturers have other names for courses, programs, controls and features.):
These Zojirushi bread machines are almost exactly the same when it comes to appearance and features. …
The biggest differences are the larger LCD and expanded course list of the Zojirushi BB-PDC20: it has 15 options compared to the 10 courses of the BB-PAC20. Another small difference is the control panel buttons that has white text on a black background.
Breadmakers.com, “Zojirushi BB-PDC20 Home Bakery Virtuoso Plus Review”
In 2022 Z0jirushi’s dealers and service agencies sold replacement pans and kneading blades for the Virtuoso for a few years. By 2025,it had discontinued those parts. In 2025, the USA web store and Amazon were offering to sell a BB-PDC20BA, (the Bread Machine Diva says the BA suffix is a code for the color scheme), with replacement parts for the BB-PDC20.
I found a refurbished Virtuoso BB-PAC20 in an online store in early 2020.
Virtuoso/V+ Basics
Dimensions
The outside dimensions (inches|cm) and weight of the Virtuoso, and the V+:
Model
End to end
Front to back
Height
Weight lb.|kg
Virtuoso
18|45.5
10.5|26.5
13|32.5
22.5|10.2
V+
18|45.5
10.5|26.5
12⅞|32.5
24|10.5
The body is metal. The outer surface of the lid is plastic. The lid has a metal inner shell that aligns to the top of pan. The lid is substantial, with a long hinge with stops that holds the lid just past vertical when raised.
The viewing window in the lid collects a little condensation during the rest period before the mix/knead phase and in the early minutes of that phase, but clears up. It lets me observe the knead and see the dough. Raising the lid turns off the motor, pausing the course until the lid is lowered into place.
These machine have a delay timer, as most bread machines do, that can be programmed to finish (and start) at a time up to 13 hours after loading and starting the machine. The timer is integrated with a clock, and can be set to time when the bread can be taken out of the machine.
Mixing Pan
The Virtuoso and the V+ have pan assemblies that can be removed from the machine to load ingredient, remove the dough or loaf, and for cleaning. The assemblies include the pans, handles, a base fitting, drive shafts, bearings and other parts. Pan assemblies are available as repair parts to the general public. I do not know if Zojirushi sells individual components of the pan assembly to service agencies.
There are very few differences between the pan assemblies of the two model. The mixing/baking pans of the Virtuoso and the V+ are identical in size.
In my experience, a V+ pan assembly fits a Virtuoso BB-PAC20 and can be used a replacement for a Virtuoso pan assembly – if a user uses mixing blades for the V+!
The pans are horizontal, and large in bread machine terminology – it will mix and bake a 2 lb. loaf. The inside measurements of the pan are 22 cm (9 inches) long by 13 cm (5 inches) wide. This pan is as long as a large (2 lb.) baking pan for loaves baked in an oven; and slightly wider. The pan is 13 cm (5 inches) high, and has clearance under the lid and lid element – i.e. capacity to bake a large (2 lb.) loaf. The pan has drive shafts for two “kneading blades” (i.e. dough hooks/paddles). The shafts pass through sealed assemblies in bottom of the pan, and have “wing nut” (also called in the literature about the V+ “coupling wing nuts” ) that fits into openings in the machines’ drive system.
A bread machine pan is both a mixing bowl and a baking pan. A metal baking pan can be oiled when dough is place in a pan to rise and bake. The bowl of an electric mixer must adhere to the dough to mix and knead, and then allow a loaf to rise and slide out after baking.
The interiors of the pans on both models have a no-stick coating that functions well and seems durable. The pan coating releases the loaf easily at the end of the bake cycle; the paddles stay on the shafts in the pan.
There is a metal rectangle riveted to the base of the pan that fits into the “baking pan receptacle” a rectangle 6¼ inches (15.5 cm.) inside the machine the base of the pan. There are fittings at the long ends of the rectangles. The pan is pushed into the base to lock the pan in, and tilted slightly to unlock. Locking the pan puts the wing nuts on the drive shafts into the drive system. Seating the pan in the base requires light pressure.
The mixing and kneading are performed by two kneading blades driven by a drive train powered by a 100 watt electric motor in the Virtuoso and the V+. This is not as powerful as the motors on stand mixers marketed to home bakers.
Zojirushi uses the motor for long periods of mixing/kneading in programming the “courses” in the control set. This ensures that the dough is fully mixed and hydrated. Zojirushi gives the dough time to ferment in the Rise phases of its courses.
Drive Shafts
Two drive shafts, mechanically attached, are part of the pan assembly on both machines. The shafts are steel and not treated with no-stick coating. The kneading blades fit on the drive shafts; each shafts fit into a socket at one of each kneading blade. (Coupling) wing nuts mechanically fixed to the ends of the drive shafts below (outside) the pan, fit into openings attached to in the drive system. The blades are rotated in jumps when drive motor is running.
Here is a 2025 picture of the inside of my Virtuoso BB-PAC20 pan assembly showing the bottom of the pan, with drive shafts, without kneading blades. The inside of a V+ pan, visually, would appear to be identical:
In both models:
Shafts project into the inside of the pan assembly though holes located in small depressions in the base of the pans.
A shaft, measured from the bottom of a depression, is about 250 mm high.
A drive shaft is mainly round, 8 mm in diameter.
There are flat sections at the top of each shaft. The bottom of the blade is held off the base of the pan by the way the blade and the shaft connect, which creates a gap.
The gap is about the width of a gift card, about .75 to .80 mm over the main bottom area of the pan – (larger in the depression at the base of a drive shaft).
The width of a gift card, and kneading blade, are shown in this photo. The kneading blade is laid flat on the table top. The width of the gift card was determined with a digital caliper:
Another way to get a look at an image of a drive shaft in a pan assembly: in the support pages at Zojirushi.com (the USA site), find a manual for the V+. You may have to download the manual as a pdf file; look at the section “Attach the Kneading Blades to the Rotating Shafts in the Baking Pan” (p. 14 for the V+).
There is a tiny change in the dimensions of the drive shafts between the models.
The shafts are round except for an area at the top of the shaft which has a flat section. There is flat section at very top of the shaft. There is a 2nd flat area immediately next to the top of the shaft – i.e. a deeper area or notch in the shaft. The differences are in the flat sections:
Dimension
Virtuoso
Virtuoso Plus
Top section
2.05 mm
1.99 mm
Notch section
2.95 mm
5.95 mm
The differences are matched by changes in the sockets of the mixing blades that fit over the drive shafts. The kneading blades for the V+ are different than the blades for the Virtuoso.
Kneading Blades
A kneading blade was shown in an image above. The blades appear to be cast from aluminum. The blades have no-stick coating. The weights of my two old blades as of July 2025 and new blades for the V+:
Worn out blade – 17.9 grams;
Worn but working blade – 18. 1 grams;
New V+ blade – 18.0 to 18.12 grams.
A blade for either machine has a cylindrical socket that fits around a drive shaft. The height of the socket is just a tad less than 25 mm. high. Each is 60 mm. long, measuring from end to end including the socket. The height of the blade portion is 30 mm.
The inside of the socket is round for a distance from the bottom (this is hard to measure). The measurement for the Virtuoso is about 18.7 mm. For the V+ it is about 15.7 mm. There is a short round section at the top of the socket for about 2.0 or 2.1 mm on the blades for both model. The inside diameter of the socket, in the round section, is 8.5 mm.
The flat areas of the sockets near the top of the blade corresponding to the flat area in notches in the drive shafts. The flat surfaces are aligned with each other when the blade is in position on the shaft. This is how force is transmitted to the blade when the drive system is active (when the machine is mixing/kneading or “knocking down” during the a rise phase). The blade cannot engage the shaft unless the blade is oriented correctly. The bottom of the flat area of the socket hits the bottom of the flat area of the notch area of shaft, which stops the blade from dropping along the shaft and hitting the bottom of the pan – it creates small gap. The top of the flat area catches the top of the notch in the shaft unless the blade is aligned. This keep the blades from lifting, sliding or falling off the shafts except when in alignment.
The V+ blades do not drop to the bottom of the shaft of the older Virtuoso. Virtuoso blades and the “compatibles” found in online stores and markets will drop to0 far down the shafts of a V+ pan.
When a blade in working condition is fitted to a drive shaft, the top of the socket will align a fraction of a millimeter below the top of the shaft; the bottom of the socket and the bottom of the blade are held off the bottom of the pan. When the flat area of the socket is worn out, the blade does not engage the drive shaft. This has consequences:
The blade contacts the base of the pan – it rest on the bottom of the pan;
The drive shaft will spin in the socket without moving the blade.
Before a blade is worn out, when a blade is worn enough it may contact the pan.
The manual recommends wet ingredients be loaded first. This machine uses the usual way of keeping yeast away from the water: the user puts yeast in last, after the flour. When the machine is loaded, both blades are in the water or wet ingredients. Both blades mix the dough. The Operating Instruction & Recipe Book (manual) included a number of recipes. The manual could be viewed at the manufacturer’s USA web site as a pdf before it was manual was removed. Most of the recipes are for large (2 lb.) loaves.
The outside of the shaft is a quarter millimeter from the inside of the socket. Water, including water with dissolved and suspended solids, can penetrate this space, and some dough normally gets in.
In my experience:
Baked material does not adhere to the blades if the blades are in good condition;
Tiny amounts of crumb (baked material) stick to the upper tips of the drive shafts;
A minute amount of dough gets into the sockets and bakes into a layer of crumb that makes the blades stick to the drive shafts
The blades may trap a little crust when the loaf is removed from the pan. When some crust is trapped, sometimes some crumb adheres to the trapped crust and may be torn out of the loaf. This depends of the final angle of the blades and the type of bread. A lean bread with a strong crust and crumb can tear..
The pan releases the loaf; the blades say with the pan. The blades may have a small amount of crumb or crust adhering. I waiting for the pan to cool and put water in the pan to a depth that covers the blades and shafts. After a short soak I can twist the blades and release them off the shafts (manually).
This photo shows the Virtuoso BB-PAC20 pan with blades. One blade is worn but still working; one is completely worn out:
The worn out blade rotates freely on the shaft and rests on the bottom of the pan.
Mixing and kneading are a single phase. The dough ball will not fill the pan until the dough ferments (rises), or the loaf springs during the first few minutes after the baking phases begins. During kneading, the dough should form a single ball that moves around the bottom of the pan. A wet dough may form two balls. Generally, the dough flows together and forms a loaf when the dough has fermented and sprung.
In some circumstances one of the blades can be lifted out of attachment to the drive shaft When this happens, the dough ball may stay at one end of the pan. The dough may flow enough fill the pan and bake into a normally shapes loaf when there is enough dough in the pan. Some times, one end of the loaf may be bigger and rise higher, or the loaf may show other signs of the way it rose and and sprung in the pan.
Heating
The heating elements of both models have the same energy settings. The main 600 watt heating element is under the pan, laid out in rectangle inside the space where the pan rests while the machine operates. There is a second 40 watt element in the lid. It is not visible when the lid is raised. It is inside the lid around the viewing window .
The main heating element is on, heating the space around the pan to 248-302 F (120-150 C) for baking the loaf in these courses:
Regular (& Quick) Basic,
Regular (& Quick) Whole Wheat,
Gluten-Free,
Cake
Home-made
Jam (heat).
The heat is on at a low temperature to heat the ingredients in the initial “rest” phase, which occurs in most courses. The heat is on at 91-95 F (33-35 C) during up to 3 Rise phases in these courses:
Regular (& Quick) Basic,
Regular (& Quick) Whole Wheat,
Regular (& Quick) Dough,
Gluten-Free,
Sourdough starter,
Home-made.
The Virtuoso and V+ turn the heating element on for short intervals during the rise phases to raise the temperature in the mixing/baking pan to enhance or speed up fermentation.
The control panel has a control button to set a crust setting of light, medium or dark. This function is active only in Regular Basic (V+ White), Quick Basic, (V+ Rapid White) gluten free and cake courses (programs).
Courses
Phases
The wheat flour baking courses were called Regular Basic, Quick Basic, Regular Wheat and Quick Wheat in the Virtuoso. The names are changed in the V+, but the times for the phases of the course are the same:
Virtu0so
Regular Basic
Quick Basic
Regular Wheat
Quick Wheat
V+
White
Rapid White
Whole Wheat
Rapid Wheat
A baking course has 4 phases.
Name
Action and purpose
Rest
The ingredients are heated a little above the ambient temperature around the machine
Mix/Knead
1. (a) Mix the ingredients, dissolve soluble solids (e.g. salt, sugar, milk powder, butter), dilute or disperse honey or sweet syrup or 1. 1. (b) Begin to hydrate the flour; /and 2. Hydrate the flour further and/or work the proteins in the flour into gluten.
Rise(s)
Fermentation. The element(s) warms the space around the pan to 91-95 ℉ (33-35 ℃) The motor is deployed to move the blades for knockdowns at the beginning of Rise 2 and Rise 3. A program with three Rise phases has sequence of rise-knockdown-rise-knockdown-rise.
Bake
The element(s) heats the space around the pan to 248-302 ℉ (120-150 ℃) to bake the loaf.
The amount of time devoted to each phase varies, but is fixed for each of the programmed courses. There is no setting to change any phase of any course for loaf size. The mix/knead phases are longer than in many other machines but not as long as in some Panasonic models.
Regular and Quick
The Virtuoso BB-PAC20 Zojirushi “Quick” courses were variations of the Regular Basic, Bake Whole Wheat and Dough courses. The differences between Regular and Quick courses were the amounts of yeast, and timing. The V+ does not have “Quick” courses but has “Fast Rise” White and Wheat courses. When the Bread Machine Diva wrote about the V+in 2021, she complained that the V+ lacked the “Quick Dough” course of the Virtuoso, which she found useful in using the Virtuoso to mix/knead and proof dough that would be hand shaped and baked in an oven – e.g. dinner rolls
Zojirushi said in the Virtuoso BB-PAC20 manual that it has tested the its programs with Fleishmann Yeast products – active dry yeast for the Regular Basic, Bake (Whole) Wheat and Dough programs, and “Fast-Rise” dry yeast for the Quick versions. This was standard for Zojirushi’s bread machines before the V+. When the V+ was released, Zojirushi’s recipes ceased to refer to active dry yeast and began to refer to instant yeast. A Virtuoso BB-PAC20 user can use instant yeast for a “Regular” course, if the amount is converted.
The brand of yeast is not important. There are no functional differences between instant yeast and Fast or Quick rise yeast products; the yeast strains are equivalent and the amounts and types of coating are the same. The Bread Machine Diva has done an article on that subject. I agree.
The times (in minutes) for these phases :
Course (Program)
Rest
Mix/Knead
Rise 1
Rise 2
Rise 3
Bake
Regular Basic
31
19
35
20
40
60
Quick Basic
18
22
20
35
0
50
R. Bake Wheat
31-41
22
27-37
30
20-30
60-70
Quick Wheat
15
27
13
30
0
60
R. Dough
23
20
45
22
0
x
Quick Dough
10
20
10
10
0
x
The Virtuoso Quick courses use more yeast with same amounts of flour, water, salt, and other ingredients. I compared manufacturer’s recipes for medium (1.5 lb.) loaves, from the manual. In a Virtuoso:
White bread is prepared on the Regular Basic and Quick Basic courses.
100% whole wheat bread is prepared on the Wheat Basic and Wheat Quick courses.
I converted Active dry yeast to Instant yeast to compare yeast quantities more clearly for the Virtuoso.
Course
Regular
Regular
Quick
Yeast (dry)
Active
Instant
Instant
Salt
Basic White Bread
1½ tsp.
4.2 g. (1½ tsp.)
2.8 g.
4.5 g.
100% Whole Wheat
1 tsp.
4.2 g. (1½ tsp.)
2.8 g.
4.5 g.
Dough, Starter, Other
The Virtuoso uses mix/knead and rise phases in the regular and quick (dough courses. These courses do not proceed to the bake phase; the user should turn the dough out immediately at the end of the course, and shape and bake the dough in an oven. The V+ has a Dough course.
The Sourdough starter courses in both machine have a short Mix phase and a single 120 minute Rise (not 3 Rises). The Recipe booklet and Book of the respective machines have recipes to make a starter from flour and water and (commercial baker’s) yeast which can then be used to bake bread later
The machines, in this course, can mix a starter or a pre-ferment (e.g. levain, sponge, poolish, biga). The fermentation time can be extended by leaving the pre-ferment in the pan longer. It could be a useful feature for users who want to use a bread machine instead of using other methods of growing and feeding “mother” starters or making pre-ferments.
These machines have:
a cake course for cake mixes, soda bread, corn bread and other chemically leavened (baking powder and/or baking soda) mixes;
a gluten-free bake course for gluten-free breads, which has a 17 minute knead phase, and a 35 minute three step rise phase;
a Jam course which heats and cooks the ingredients, then mixes them.
Home Made
The Virtuoso and V+ provide for saving 3 “Home made” courses (custom programs) in which a user may set the time for the initial rest, mix/knead, rise (3x), and bake phases in a range. Temperatures for the rise phases and bake phase are preset.
Raisins, Fruits, Seeds
A baking course by default, sounds a beep to prompt the user to add raisins or other ingredients late in the kneading phase. The prompt can be turned off when the machine is set. This feature was no changed in the V+/
Not included in the Virtuoso..
The Virtuoso did not have
a French or European bread course,
an explicitly named multigrain course, course or
a No Salt course
but can manage these breads.
Rye bread
There is no rye course. Zojirushi had/has recipes in the (Whole) Wheat course sections for bread with a little rye flour in its recipe books:
for the Virtuoso, a printed “Operating Instructions and Recipes” booklet; in the “Wheat” (i.e. Whole Wheat) course section. I still have my copy – the booklet was removed from the support material available to consumers and the public at Zojirushi.com;
the Z+”Recipe Book”, a V+ support document at Zojirushi.com, still available in 2025.
One was “light rye” requiring over 4 cups of bread flour and ⅔ cup of rye flour to make a large (2lb.) loaf in the Virtuoso publication, changed to about 3 cups of bread flour, ½ whole wheat flour and 1 cup of rye flour for the V+. Both publications have recipes for a “pumpernickel” loaf with wheat flour, cocoa powder and instant coffee, and less than a cup of rye flour.
The Virtuoso (and the V+) do not handle rye flour beyond a very small amount. The machine does sandwich bread made from wheat flours, with some options.
Differences
+/-
The V+ has all the courses the Virtuoso had including Sourdough starter, Cake, Gluten Free, Jam, but it lacks a Quick/Rapid Dough course.
European Bread
The V+ has a European bread course, which seems to be intended for baking lean crusty bread. On of the recipes in V+ recipe book is identical to the recipe in the Virtuoso BB-PAC20 “Instruction & Recipes” booklet for Crusty French bread in the Home Made section. The booklet include a suggestion on programming a Home Made courses for the recipe. The suggestion is almost identical to the “European” bread course in the V+ :
Rest
Mix/Knead
Rise 1
Rise 2
Rise 3
Bake
22
18
35
50
Off
70
Multigrain
The V+ has a multigrain program, similar to the V+ White and Whole Wheat programs. The V+ recipe book has Multigrain course recipes – most of which were Virtuoso Basic or Wheat course recipes.
Most loaves which involve mixtures of large amounts hard wheat wheat flour – either bread flour or whole wheat and some non-wheat flours (e.g. buckwheat, soya) flours and items like rolled oats and bulgur can be mixed and baked in regular bake and Bake (Whole) Wheat courses in either machine.
No Salt
The Virtuoso had a No Salt recipe for a bread flour white bread loaf, but did not have a dedicated course for mixing and baking salt-free bread. The V+ has a No Salt course which has a recipe in the V+ recipe book.
Any bread machine can bake bread made without salt (or using vinegar to slow the action of the yeast – e.g the Zojirushi No salt sandwich loaf). Baking bread without using salt requires using less yeast.
Etc.
The V+ has courses for bread made without sugar and vegan bread.
Loaf Size, Yeast & Salt
Medium Loaves
A recipe for a medium loaf can be mixed, kneaded, proofed and baked in the large loaf pan of a BB-PAC20 on the factory settings for the regular bake and whole wheat bake programs on the machine’s settings. . A few recipes in the “Operating Instructions and Recipes” booklet are for medium (1.5 lb.) versions of large loaf recipes.
A medium (1.5 lb.) loaf is 75% of a large loaf recipe. The dough for a medium loaf generally will flow and fill the bottom of the pan as the dough rises. The height of a medium loaf, baked, from the bottom of the pan to top of the loaf at the wall of the pan is about 8 cm at the side of the pan; to the top of the crowned (domed) top of the loaf, 10-11 cm.
I tested the 1.5 lb. (medium) recipes in the Virtuoso “Operating Instructions and Recipes” booklet. I tested the recipes without reducing salt or yeast. I tested medium recipes if given, or large recipes scaled to medium, for loaves made with Bread flour and/or Whole Wheat flour. I converted yeast in these recipes from Active dry yeast to instant yeast. I include the weight in grams of main ingredients for medium loaves, in the recipes published by Zojirushi:
Name
p.
Course
B fl.
WW fl.
H2O
Salt
IY
White Bread
14-15
Regular Basic
416
0
240
8.4
2.8
100% WW
18
Regular Wheat
0
420
320
5.6
2.8
Italian Wheat
19
Regular Wheat
256
180
270
6.3
3.8
Crusty French
44
Home made i.e. custom
416
0
240
5.6
2.8
These medium recipes worked. The dough flowed enough to fill the pan to both ends and front to back. It rose, sprung and baked into loaves within the pan and well under the lid. I put these recipes into worksheets or tables for my future reference to help work out conversions for recipes from the Bread Lover’s Bread Machine Cookbook and other sources.
These recipes will work with less salt than the recipes in manuals say.
Yeast
Medium loaf recipes from the Bread Lover’ Bread Machine Cookbook (2000) (“BLBMC“) recommended 1.75 tsp. (5.5 g.) or 2 tsp. (6.2 grams) +/- instant yeast for 3 cups of bread flour, or 1.5+ cups bread flour blended with 1.5 cups of whole wheat flour, and 1.5 tsp salt. For the BB-PAC20, I need 50-70% of the instant yeast in a BLBMC recipe. (A little more than I would use in my Panasonic.) I also bake with less salt, and reduce yeast for that reason as well.
Virtuosos supports low sodium baking, as any bread machine does.
It is possible to keep a Virtuoso running by using a V+ (BB-PDC20) pan assembly and V+ (BB-PDC20) kneading blades. Zojirushi never advised consumers or sales forces about the possibility of using V+ baking pan assembly and kneading blades in a Virtuoso.
Value
Price
The retail price of a Virtuoso, when new machines were available was a premium price – more expensive than most other bread machines.
The Virtuoso Plus BB-PDC20BA was offered for sale in the US, for $420 ($US) in July 2025 in the Zojirushi.com (USA) web store and on amazon.com. The BB-PDC20BA was offered for sale in Canada on amazon.ca, on sale, with “free” delivery for $626 ($Canada) at the same time. The currency exchange rate, shipping and tariffs were a factor in the pricing. Availability in Canada from was uncertain. Zojirushi and actors in the supply chain, and Amazon.com would not sell or ship to Canadian buyers
Virtues
The Virtuoso BB-PAC20 is quiet. It is stable, partly due to its weight, and partly because it is a balanced machine It doesn’t rattle or try to dance off the counter, unlike many machines by other manufacturers, and earlier Zojirushi bread machines.
It is good at sandwich loaves made with wheat flour, water and yeast – the kind of loaves that industrial bakers mass produce with direct (or straight) dough methods. It lets such dough “rise” (ferment), and bake for about an hour in a baking chamber smaller but as hot as a conventional oven. The loaves develops an even crumb structure and a sweet brown crust.
The inside of baking pan and the exterior surfaces of the kneading blades have been treated with a no-stick coating. The drive shafts are not coated. Non-stick coating of baking pans is a common feature of bread machines made after 1980,
The Virtuoso provides heat while the dough is being “proofed” (i.e. rising or fermenting before the dough is baked), incorporating the function of a proofing box (a device used by some bakeries and a few home bakers) into the bread machine.
The V+ has the same features.
Limitations
While Zojirushi suggests that the Virtuoso and V+ can mix, knead and bake any kind of loaf, with any ingredients a user may want, these machines are specialized. I use the Virtuoso for wheat flour loaves. It is what it is and it ain’t what it ain’t.
I have not tried to use the gluten free programs and recipes. I was not influenced by that feature.
The blog at the Zojirushi USA site said the non-stick coating:
… is made using PTFE, or polytetrafluoroethylene, a polymer that is applied in a two-step process with a primer and a topcoat. It is nonreactive, inert, ultra-smooth, hydrophobic, and resistant to abrasions, corrosion, and heat.
PTFE is a PFAS chemical which can be a hazard for the workers who may be exposed, and for persons consuming products prepared in cookware with coating made with PTFE, using the word hazard in the sense explained by the Government of Canada’s Centre for Safety and Occupational Health, (“CCHOS”), as source of potential danger:
A hazard is any source of potential damage, harm or adverse health effects on something or someone.
Basically, a hazard is the potential for harm or an adverse effect (for example, to people as health effects, to organizations as property or equipment losses, or to the environment).
The bearings and seals of the drive shafts built into the baking pan or either machine can wear out. This happened with my Virtuoso, in 2022. At that time replacement pan assemblies for that model were still available.
The bit of metal that is used to make the flat section of the socket of a kneading blades will wear out. If that part of the blade was not weak and loose, the whole machine might fail. The V+ appears to be better than the Virtuoso – the socket of the kneading blade has more material in a critical area. The kneading blades are vulnerable to wear and eventual failure. This appears to have been a design feature. The feature probably has a safety justification.
The Bread Machine Diva said in a post about the Virtuoso in 2019:
… I use my bread machine two to three times every week. In my experience, Zojirushi bread machines will last four to six years under those conditions. Paddles [kneading blade] and other parts are available on Amazon or from Zojirushi.
I do need to buy new paddles every few years.
Bread Machine Diva, “What Bread Machine Should You Buy” – why Zojirushi, July 14, 2019, last updated April 5, 2025, viewed July 30, 2025
She did not explain what led her to buying new kneading blades.
Zojirushi did/does not discuss the issue of regular replacement of parts in any of its bread machines. (Except there was a reference to a battery for the internal clock in the Virtuoso “Operating Instructions and Recipes” booklet). There was no discussion of service life or the need to periodically replace kneading blades .
Zojirushi made pan assemblies and kneading blades for the BB-PAC20 available for a few years after the model BB-PDC20 was introduced (2019); replacement parts for the BB-PAC20 disappeared from Canada by 2025. In 2025, a few retailers in the USA still offered to sell BB-PAC20 pan assemblies and ship them to Canada. Blades were gone in Canada and the USA by July 2025 except “compatible” blades without coating made by a third party manufacturer in the Amazon market. The vendor and Amazon offered prompt service without any practical assurance that the goods were fit for the purpose.
I wrote and published this in 2021. After major changes, I republished in 2025.
Bread
Definition
Bread is made by mixing flour and water into a dough, kneading the dough, and baking the dough:
Bread is a combination of flour and water that has been baked. Over the years, its production has become increasingly more complex. Bread is a staple food in many countries, with cultural significance. With common sayings such as “the bread winner,” it has become one of the most important parts of the world’s diet.
Flour refers to a powder used in cooking and baking. It can refer to silt or sediment such as rock flour. Bakers refer to ground grain – usually the seeds of cereal plants – i.e. certain grasses – wheat, rye, barley. Some legumes (e.g. chickpeas, soybeans) are also ground or milled into flour
Defining bread as a combination of flour and water skips the history of growing, processing (cutting, threshing, drying). and grinding or milling grain. Milled grain has become the commodity known as flour. Much of the science and the writing on bread in the 19th and 20th centuries have addressed mixing flour and water into dough and baking dough into bread.
Wheat and wheat flour have the proteins that bond into the complex protein, gluten, when flour and water are mixed. Other grains have less of these proteins and some other protein. Bakers knead dough, stretching and folding it on itself, repeating the motion for several minutes. The dominant theories are that kneading “structures” the gluten, or increases the hydration of flour. A baker can pause after mixing or start kneading, or pause during kneading. The dough should be viscous (tenacious and elastic) to hold together, but extensible to stretch, and to flow.
When the small particles of a milled flour are mixed with water, starches dissolve. The starches are rearranged by mixing flour with water, until the wet flour became a mass of dough.
Dough bec0mes bread when it was baked – heated by warm air or contact with a heated metal or ceramic surface. An unleavened dough may be baked into flap of flatbread or a cracker. Unleavened bread may have some natural yeast in the ground grain, which only has a few minutes to act, after the grain is hydrated.
As leavened dough is baked, it rises until the microbes have died or chemical reactions have stopped. A leavened dough could rise into a shape that would become a bun roll, or a loaf. The outside of the dough became the crust. The inside became crumb.
Grain and flour are NOVA class 1 unprocessed or minimally processed foods.
Grain & Flour
As the first hominids and homo sapiens evolved, they ate seeds. Hom0 sapiens began to grow certain grasses, harvest them, and dry the seeds. Human beings began to crush the seeds, mix dried crushed seeds and water into a mush or paste, use fire to cook the mush Eventually human beings discovered that wet mush made with fruit or grain could become a drinkable substance containing alcohol or something gassy and that gassy mush, when heated, became somewhat sweet and tasty. Also, human beings made machines to crush the seeds into meal and flour.
Several civilizations cultivated grasses (notably wheat, rice, corn) and some other plants (e.g. potatoes, yams, squash in the Americas) for starch, and legumes for more nutrition. Wheat, and other grains, became food sources in parts of the world and the civilizations that formed there. The history of baking before 19th and 20th centuries has been uncovered by historical research and .archeological studies.
Milling refines flour. The grain and the milled grain contain natural wheat seed proteins. In the 20th century milled and regulators set standards 0f minimum and uniform levels of protein. Bread flour milled to US and European standards (and Canadian All-Purpose) at 12.5% has more of the proteins that bond to form gluten. Gliadin and glutenin are insoluble proteins. When water is added to flour, these proteins bond into gluten a composite of storage proteins … found in wheat, barley, rye, oats, related species and hybrids … “. Gluten gives elasticity to dough, helping it keep its shape and often gives the final product a chewy texture. Gluten relaxes which lets the dough flow and rise.
In the processes of harvesting, drying, grinding and milling grain the starches and proteins in the endosperm of the grain are separated and preserved. Milling can extract and concentrate the natural proteins as vital wheat gluten (“VWG”) powder or flour:
Consisting of mainly gliadin and glutenin, wheat gluten is unique among cereal proteins based on its ability to form a cohesive and viscoelastic mass. This rheological property makes it a dynamic material that is able to grow and keep the gasses within the dough during extended fermentation periods. The viscoelastic nature also provides the oven spring (increase in height due to the expansion of gasses) that we see in the oven.
….
The addition of VWG generally increases the dough mixing time and fermentation time. As more protein solids are added, more water is needed for complete flour hydration.
Due to its cohesive and viscoelastic properties, its main function is a dough strengthener. It is also a film former, binder, texturizer, fat emulsifying agent, processing aid, stabilizer, water absorption and retention agent, thermosetting agent, and a flavor and color binder.
Vital gluten can absorb almost twice its weight in water (140–180% water). The quality of dry vital gluten is estimated with the Brabender farinograph or Chopin Alveograph. The breadmaking quality of VWG is also assessed through standardized baking tests.
Whole wheat and bread flour weigh the same amount per unit of volume. Whole wheat flour, pastry flour and American all-purpose flour have proteins to make gluten but not enough to work in modern bread baking.
Leaven
In the middle East, Europe and America, for centuries, most bread has been made with a “leaven”. Leaven was discovered before bakers and scientists understood yeast or made the cultivation of yeast conceivable. A living microbiome or culture of yeast and bacteria was used to raise bread dough Bakers used such wild leavens wherever ground wheat or flour was available, for 6,000 years. The growth of a microbial culture that can leaven (and affect the flavor) bread dough is a common occurrence when flour and water are infected by Lactobacilli bacteria and “wild” yeast. Dr. Pallant’s Sourdough Culture (noted below) discussed some of the archeology and ancient history. Until leavens became commodities, leavening was a method learned by trial and error and taught by demonstration, word of mouth, apprenticeship and practice.
Saccharomyces cerevisiae, known as vintner’s yeast, brewer’s yeast and baker’s yeast, was scientifically identified as the biological agent of fermentation in the middle of the 19th century. Sourdough Culture discussed the success of Austrian industty, late in the 19th century, in cultivating baker’s yeast, producing wet yeast cakes, and bringing the innovations to the USA.The industrial production of baker’s yeast (and chemical agents like sodium bicarbonate) began in the 19th century.
For most of the 20th century, industrially grown baker’s yeast was a commodity and dominated the business of baking. The yeast industry developed processes for breeding, feeding, harvesting, compressing and transporting yeast and developed products for people who were able and willing to bake bread instead of buying it. In middle the 20th century, the yeast producers developed dry yeast and started to sell dry yeast. Late in the 20th century, the dried yeast processes were changed, and various new dried yeast products
There were bakers in France, parts of the USA and elsewhere in the world who continued to use traditional leaven. In France, bakers used both cultivated yeast and traditional leaven. Traditional leaven would be used to make pre-ferments to affect flavor, and cultivated yeast was used to get dough to rise faster and more predictably.
Traditional leaven was also practiced in the sourdough traditions in the USA. Dr. Pallant’s Sourdough Culture discussed the way that natural leaven was presented in the myths about sourdough and about the miners of the San Francisco and Klondike gold rushes in the Western USA and Alaska. Some bakers in San Francisco promoted their their product as “authentic” sourdough on the basis that there is something special about a small area of northern California and used the California Gold Rush myth as a promotional story. Dr. Pallant praises modern bakers and authors including Peter Reinhart (below) and Chad Robertson, (author of Tartine Bread (2010); a founder of the eponymous bakery). Prof. Pallant noted that the San Francisco myth has been deflated by the discoveries that the production of lactic acid by Lactobacilli favours the success of “wild” bread yeast, and of the discovery of several kinds of Lactobacillus by analysis of the genomes.
Modern Bread Production
Industrial
Most people purchase bread made by industrial bakers from grocery stores. Some shop at bakeries. Unpackaged bread is a NOVA class 3 processed food, if the bread as baked under these conditions:
Processes include various preservation or cooking methods, and, in the case of breads and cheese, non-alcoholic fermentation. Most processed foods have two or three ingredients, and are recognizable as modified versions of Group 1 foods. They are edible by themselves or, more usually, in combination with other foods. The purpose of processing here is to increase the durability of Group 1 foods, or to modify or enhance their sensory qualities.
https://world.openfoodfacts.org/nova
Packaged industrially baked bread is a NOVA class 4 ultraprocessed food due to the additives and the processing of ingredients:
Additives in ultra-processed foods include some also used in processed foods, such as preservatives, antioxidants and stabilizers. Classes of additives found only in ultra-processed products include those used to imitate or enhance the sensory qualities of foods or to disguise unpalatable aspects of the final product. These additives include dyes and other colours, colour stabilizers; flavours, flavour enhancers, non-sugar sweeteners; and processing aids such as carbonating, firming, bulking and anti-bulking, de-foaming, anti-caking and glazing agents, emulsifiers, sequestrants and humectants.
A multitude of sequences of processes is used to combine the usually many ingredients and to create the final product (hence ‘ultra-processed’). The processes include several with no domestic equivalents, such as hydrogenation and hydrolysation, extrusion and moulding, and pre-processing for frying.
The overall purpose of ultra-processing is to create branded, convenient (durable, ready to consume), attractive (hyper-palatable) and highly profitable (low-cost ingredients) food products designed to displace all other food groups. Ultra-processed food products are usually packaged attractively and marketed intensively.
https://world.openfoodfacts.org/nova
Many people have kitchens and ovens and could bake bread if they purchased flour and other ingredients and had time, and knowledge of technique and science. It is a specialized activity. Bread baking may have been a part of the education of students in home economics courses. Persons who work in bakeries may have taken courses in vocational educational institutions or learned from experienced bakers in work experience.
A professional baker will probably use a mechanical mixer; many home bakers may have one. A mechanical mixer or stand mixer uses mixing arms, a paddle or a spiral dough hook in a circular or elleptical motion. A mixer has a range of speeds. The baker uses a slow speed to mix the ingredients and a higher speed to knead.
Leaven, Processed Yeast, Chemical Agents
Modern bakers, depending on location, culture, and resources still produce unleavened or partly leavened flat bread. A rising agent is necessary to create bubbles in the dough that create the bubbled texture of the “crumb” inside the crust of the baked loaf.
Rising is caused by the infection of the wet flour by yeast. The yeast Saccharomyces cerevisiae, also known as vintner’s yeast, brewer’s yeast or baker’s yeast, causes fermentation of fruit and grain, which makes it possible to make wine, beer (and spirits) and to leaven dough to bake bread.
Yeast consumes some of the starches in dough- it ferments, creating gas, which is trapped in gluten in the dough, which makes the bread rise, after the dough has been kneaded. Bakerpedia explains, condensing a number of complex biochemical processes:
When yeasted dough ferments [it] rises and increases in volume, and flavor is developed. Yeast converts starch in flour into sugar, carbon dioxide and ethyl alcohol. CO2 gas is trapped by gluten proteins in the flour which causes dough to rise. Fermentation results in a light and airy crumb.
The propagation of yeast and the fermentation of dough accelerate. The dough rises in 2 or 3 stages: bulk fermentation, intermediate, and final proof. Dough is folded or knocked down to release gas at the end of the bulk fermentation, and folded when the loaf is shaped. The dough rises again in the baking pan and springs when yeast warms up after the pan goes in the hot oven, before the heat kills the yeast.
Bacteria and yeast are “wild” organisms in the air or on the ingredients. The traditional method was based on natural infection. Some bacteria could cause interesting tastes, which were not always well received by consumers and bakers.
Some bakers took yeasty foam over the top of ale being fermented as the yeast consumed the starches in the brewed liquid, which brewers called the “wort”. Bakers began to cultivate yeast at the end of the 18th century. The industrial production of yeast began in the 19th century. Industrial bakeries mainly use yeast leaven evenly, quickly and efficiently. In the late 18th century, bakers, chemists and biologists in the Austria-Hungarian empire found a way of growing cultures of pure baker’s yeast. Pure yeast was skimmed, compressed into cakes of wet yeast. This process was adapted and industrialized. The Austrian Fleischmann family industrialized the process in the USA in the late 19th century. 20th century changes in yeast production:
During World War II, Fleischmann’s developed a granulated active dry yeast for the United States armed forces, which did not require refrigeration and had a longer shelf-life and better temperature tolerance than fresh yeast; … . The company created yeast that would rise twice as fast, cutting down on baking time.
In 1973, Lesaffre created instant yeast (also called “quick rise” or “fast acting” yeast), which has gained considerable use and market share at the expense of both fresh and active dry yeast in their various applications. Instant yeast differs from active dry yeast in several ways: Instant yeast rises faster than active dry yeast; instant yeast can be directly added to the dry ingredients, whereas active dry yeast should be mixed with liquid (water, milk or beer) and proofed before mixing; instant yeast has a lower moisture content; and instant yeast is formed of smaller granules.
Cultivated processed yeast became the main leavening agent for bread baking. natural leaven was still used to create pre-ferments – e.g. levains, sponges, biga and pâte fermentée (old dough) used in conjunction with baker’s yeast. The traditional method of rising dough have been perpetuated by artisanal bakers and bakers who bake sourdough.
The most precise way of measuring is by weight. Commercial bakers measure many ingredient by weight. The measurement of concentrated ingredients including yeast (and salt) by weight is also desirable for home bakers and bread machine bakers. Few home bakers have scales precise enough.
Some sources say for instant yeast: 1 tsp = 3.15 grams. Peter Reinhart, The Bread Baker’s Apprentice (Ten Speed Press, 2001) says on p. 28 that 1 tsp instant yeast = .11 oz which converts to 3.12 grams. It is hard for home user to verify the weight of a teaspoon of instant yeast with home tools and methods.
Commercial bakers also use chemical leaven for some bread: baking powder and baking soda for corn bread, soda bread, cakes and other baking. Baking powder is baking soda mixed with cream of tartar. Kraft Foods Magic Baking Powder does not provide Food Facts on the labels of small jars in Canada. The published information is that 1 tsp. of baking powder has 300 mg. of sodium. Substitutions for baking powder involve 1/4 tsp of baking soda plus some acid (e.g. vinegar, cream of tartar) for each tsp baking powder. Baking soda is sodium bicarbonate. It has 1,259 mg. of sodium per teaspoon. A functional substitution for baking soda and baking powder: potassium bicarbonate, the key ingredient of Featherweight – not an widely available (i.e. in grocery stores) product. It is available as a supplement but has a list of side effects and do not use if taking medication warnings. Please Don’t Pass the Salt has recipes for quick breads, and suggestions on low sodium “baking mixes”. “Natural” products that that might trap CO2. Some recipes for some baked goods suggest that some natural products may trap CO₂ e.g. whipped egg whites.
Salt
Mark Kurlansky’s book Salt: a World History (2002) tells of the use of salt to bake bread in Egypt (3,000 BCE), The production of salt may have started about 8,000 years ago.
Salt is part of the process for most bread sold by grocery stores and bakeries large and small. Bread is high in sodium, as an effect of the baking process. Salt is a standard and necessary ingredient in most formulas and recipes. A few bread styles, such as Tuscan bread, are made without salt. Salt:
affects the development of gluten. It affects chemical bonds in amino acids in proteins in flour that has been exposed to mixed with water. It makes the gluten more tenacious and elastic;
controls yeast which affects fermentation. Fermentation affects flavour but it also affects rise, which affects the size of the loaf and the production line.
The right ratio of flour to salt and yeast, among other things, means a loaf that will rise on time, and not overproof or balloon. The loaf should spring in the oven and crown to form a dome.
Salt can be reduced, with a reduction in the amount of yeast. Some books and internet pages eliminating salt but incorrectly list the same amount of yeast that would be used if there was salt in the recipe! This will may bake or collapse. In a bread machine, the dough will balloon and may or collapse before it overflows the pan.
Every reduction in salt has to be balanced with a reduction of yeast. Please Don’t Pass the Salt has recipes for yeasted breads and a note on the general adjustment for yeasted bread recipes. Artisan bread baking writers suggest that adjusting the salt in formulas leads to unsatisfactory results – e.g. Peter Reinhart, Artisan Bread Every Day (Ten Speed Press, 2009) at p. 15 suggests not reducing by more than 10%. Salt and kneading affect gluten. It is easy to get to reduce salt to 50% and 33% reduce the salt added to the mixing machine when dough is mixed. These reductions are not usually made by industrial bakers. Changes in salt will affect the gluten, affecting texture, and storage of bread, as well as fermentation and taste.
An accepted rule of thumb is reducing proportionately by weight to maintain the same percentage.
Goal
Reduction
Use Salt
Use Yeast
50%
50%
50%
50%
33%
67%
33%
33%
Professional bakers and some home bakers express ingredient lists or recipes in baker’s percentage (B%) to use consistent processes to manufacture a consistent product. Professional bakers may use 2 pounds of salt and .77 pound of instant yeast per 100 pounds of flour. The B% for salt is 2%; the B% for instant yeast with most loaves made with bread flour is .7% but B% can vary. It may be over 1%. A yeast B% of .7% in one loaf works out to .3 ounces = 8.5 grams = 8,500 mg. salt per 3 cups (15 ounces) of flour. A normal loaf of bread weighing 1 ½ lbs. (a bread machine medium loaf) has 3,400 milligrams of sodium per loaf – several hundred milligrams per slice or serving. Home bakers work with small amounts of salt and yeast. Bread machines use very small amounts for single loaves.
Conversion? The majority of recipes refer to standard ground table salt. For table salt: 1 tsp = 5.7 grams or .20 oz. Some fine crystal table salt on the market in the US weighs 7 grams per teaspoon. I do not pay attention to this information unless the recipe I am referring to has used a coarse or fine salt:
America’s Test Kitchen/Cooks Illustrated The Science of Good Cooking (2012) lists several brands of kosher salt and sea salt and compares them to table salt, suggesting that Morton’s brand is the standard for table salt at 1 tsp = 7.15 g.
Peter Reinhart, The Bread Baker’s Apprentice (Ten Speed Press, 2001) says on p. 28 that 1 tsp of table salt = .25 oz which converts to 7 grams.
The size of the salt crystals affects solubility, which can affect the distribution of salt in the dough, and effect of salt on yeast. However a gram of kosher salt works as well as a gram of table salt for baking bread.
Resources
Skill, knowledge, Practice
Grinding grain, milling flour and baking bread were skills taught by demonstration; bakers learned by doing for centuries. Emily Buehler wrote:
Reading about bread will not be enough … the only way to know dough and bread is to have your hands in it – practice. … “failures” are just opportunities to learn. … messed up bread often still tastes good!”
….
Good bread is not the result of one brilliant mind; it came about by trial and error, over the centuries … by ordinary people; it does not require special talents or an advanced degree. Relearning the process from the beginning is surprisingly simple. … making bread “by hand” might seem to be a lost art, but it remains accessible to anyone …
Emily Buehler, Bread Science, (2006, 2021. Two Blue Books, Hillsborough N.C., USA)
Sources
I will mention some sources, their publications. I will start with a “who” section for several sources.
Much of the information published in books or electronic media including the internet, written in or since the late 20th century by agricultural sources, millers, bakers, restaurateurs, journalists and other writers assumes an understanding of milled flour, clean water, energy for machinery and ovens, cultivated yeast, science and technology that happened in the 19th and 20th centuries.
Cookbooks were a popular format for communicating knowledge about food and cooking, including baking, and including bread baking. They are transitory products. Recipe books respond to trends and fads. Cooking technology changes. Ingredients change.
Many cookbooks have been written by persons without accreditation or formal vocational training who had worked in restaurants, kitchens and food preparation, including bakeries and had talked to persons who cooked for sale and prepared food for themselves. The sciences of food involve
the chemistry of heated food,
the chemical composition of food,
the use of chemical compounds in cellular biology,
the anatomy and physiology of digestion,
the physiology of taste,
the psychology of taste,
the social psychology of food preferences, and
the social psychology and economics of marketing and communication.
The San Jose Mercury Writer
Who
In The Bread Bible Beth Hensperger mentioned her experience baking in a restaurant kitchen, holding workshops, teaching and writing in the introductory chapter, “The Art and Science of Good Baking”. She became a writer on bread. She was a journalist and columnist with a following among home bakers. She wrote 2 books titled as Williams Sonoma cookbooks.
Hensperger wrote about things she knew, and went into some detail. Her books, including The Bread Bible, were directed at the perception that home bakers wanted information though form of recipes being shared, presented in the cookbook format using measurement by volume (e.g. cups, tablespoons, teaspoons and fractions of those standards). The Bread Bible‘s recipes:
were for home bakers who baked in ovens;
mainly used ingredients available to retail customers in stores in large American urban centers.
Her list of works in Goodreads contains of 30 works in before 2011. Her biography on the Amazon Store said:
Beth Hensperger, a New Jersey-born who now considers herself a California native, has been educating, writing, and demo-lecturing about the art of baking bread and cooking for thirty years. …
Hensperger’s writing career began when she was chosen as the guest cooking instructor for the March 1985 issue of Bon Appétit. Now she is the author of over twenty cookbooks, including the best-selling Not Your Mother’s Slow Cooker Cookbook series, which includes Not Your Mother’s Recipes for Entertaining, Not Your Mother’s Family Favorites, Not Your Mother’s Weeknight Suppers, and NYMSC Recipes for Two along with the blockbuster first volume, Not Your Mother’s Slow Cooker Cookbook. Also from The Harvard Common Press are The Bread Lover’s Bread Machine Cookbook, The Ultimate Rice Cooker Cookbook, and The Best Quick Breads. She is also the author of The Bread Bible, winner of the 2000 James Beard Book Award in Baking, and nominated twice for an IACP Cookbook Award.
Hensperger wrote a food column, “Baking with the Seasons,” for the San Jose Mercury News (which was nominated for a James Beard Award in newspaper journalism) for over 12 years until the newspaper downsized.
Beth Hensperger had a web site with many recipes, at one time. The web site was gone by 2021; her domain was high-jacked by web squatters. Information about her life and career are drowned in returns in searches by results for pages published for online booksellers selling copies of her books .
There is a note by “Darcie” March 25, 2021 in the blog section of the otherwise paywalled Eat Your Books web site:
We learned through cookbook author Rick Rodgers that acclaimed San Francisco Bay Area-based food writer, cooking instructor, and bread baking maven Beth Hensperger has died after years of declining health. An editor who worked with Hensperger confirmed her passing although there has not yet been an official announcement.
When The Bread Bible: Beth Hensperger’s 300 Favourite Recipes, (1999) Chronicle Books, San Francisco was published, Hensperger was known as a columnist and as the author of 5 books. The Bread Bible earned the James Beard Foundation award in 2000 in the Baking & Dessert category. It has a cover photograph and some photographs of dough and bread products. It was published as an e-book, apparently in 2013, when it appeared in Amazon Kindle format. As of 2025 is for sale online as an e-book 0r a used book. It has 300 recipes. A person might buy the book as a resource, and use it successfully as the available ingredients changed.
Beth Hensperger’s The Bread Bible is lengthy, but is neither authoritative or complete. The subtitle, “Beth Hensberger’s 300 Favorite Recipes” really gets to what this book is: a large collection of good recipes.
The Bread Bible did not discuss commercial baking. It mentioned but did not discuss the artisanal baking movement, which was known in California in the 1980s. It mentions balanced recipes but does not explain baker’s math or baker’s percentages. Few books except trade publications and education material for baking courses did.
Active dry yeast was the preferred way of leavening bread made with wheat flour in the second half of the 20th century. Active yeast was improved near the end of the 20th century when the processes for drying yeast and packaging. Yeast processors retained familiar ways of packaging the produce – foil packets and small jars, filled the packages with more live yeast, and changed the description of the amount, by volume of half and ounce of dry yeast measured by weight. In recipes, Hensperger used active dry yeast measurements, familiar in the late 90s, stating the a half ounce packet was a “scant tablespoon” active dry yeast by volume. A .5 ounce (8 gram) packet, for several years before 2025, has been 2¼ teaspoons. This affects the use of the recipes. It requires a baker to make an adjustment when using active dry yeast, or to make a calculation to convert if using other kinds of dry yeast.
Bread baking has somehow taken on a mysterious quality, making it seem an intimidating act for many people. The secret to making good bread is that there is no secret. Let your imagination help you break any rules you imagine exist to daunt you.
Reckless Appetites, Ecco Press, 1993
Later in the opening chapter she cited books that had influenced her: theTassajara Bread Book (1970), A World of Breads (1966). The effects of water, yeast and flour on each other and of a hot oven on wet dough are real constraints.
Within a page of that epigraph, Hensperger noted:
Successful baking combines the elements of a balanced recipe, proper equipment, and good ingredients with skilled hands and a dash of imagination.”
The Bread Bible describes how dough it mixed and bread is baked in the chapters: “The Baking Process” and “The Elements of a Loaf: Ingredients”. The information reflects the common sense of late 20th century bakers, based on centuries of baking.
Her discussion of Yeast in the “Ingredients” chapter goes into some details – e.g. how to acquire compressed wet yeast cakes and bricks. She is vague on history of the cultivation and processing of yeast, but makes the point that yeast are microscopic living things.
She mainly discusses active dry yeast (without mentioning it was an invention first marketed in the 1940s). She emphasizes that the contents of a container of active dry yeast include live yeast, and states that the live yeast has to be “proofed” (activated) by hydration and nourishment with sugar, and is perishable. She discusses how active dry yeast was presented on the baking supplies shelves of grocery stores. It was and is sold in strips of 3 foil half ounce (8 gram) pouches and glass jars holding 4 oz. (113 g.) or 8 oz. (227 g.).
She discussed other processed yeast products that could be added dry that were dried and processed differently . She said instant, Quick-rise and Bread Machine were interchangeable with other dry yeasts. Indeed, all are baker’s yeast, that consume starch and pump out gas.
She said instant yeast, which she called a European strain, had started to be available at the end of ’90s. She was referring to the LeSaffre products sold in the USA by King Arthur Flour. She did not present, and may not have fully understood information about how active dry yeast and instant yeast were made, summarized (in 2022):
Instant yeast: … used in my kitchen since King Arthur introduced it to home bakers over 25 years ago. Specifically, … SAF Red instant yeast (or SAF Gold for sweet breads). …
….
… Originally, the classic active dry yeast manufacturing process dried live yeast cells quickly, at a high temperature. The result? Only about 30% of the cells survived. Dead cells “cocooned” around the live ones, making it necessary to “proof” the yeast — dissolve it in warm water — before using.
These days, active dry yeast is manufactured using a much gentler process, resulting in many more live cells. Thus, it’s no longer necessary to dissolve active dry yeast in warm water before using — feel free to mix it with the dry ingredients, just as you do instant yeast.
Active dry yeast, compared to instant yeast, is considered more “moderate.” It gets going more slowly, but eventually catches up to instant — think of the tortoise and the hare. Many bread-bakers appreciate the longer rise times active dry yeast encourages; it’s during fermentation of its dough that bread develops flavor.
….
Instant yeast … is manufactured to a smaller granule size than active dry. Thus, with more surface area exposed to the liquid in a recipe, it dissolves more quickly, and gets going faster than active dry. While you can proof it if you like, it’s not necessary; like active dry yeast, simply mixing it into your bread dough along with the rest of the dry ingredients works just fine.
Hensperger noted instant yeast, bread machine yeast and Quick-rise yeast were dried differently than active dry yeast, had finer (smaller) particles, and used different coatings to make the particles of yeast:
instant yeast was coated in ascorbic acid and sugar;
bread machine yeast was coated, with ascorbic acid and “a flour buffer”.
Quick-Rise yeast was grown differently than active dry, and treated with conditioners including emulsifiers and anti-oxidants.
Fleischmann’s still uses Quick-Rise as the name for its fast rising dry yeast product. Fleischmann’s may have a trade mark or some protection for the name. Competitors use different names. The selling points for fast rising yeast were that it could be used dry, and that it was faster than active dry yeast. A given volume – say a tablespoon – has more live yeast cells. It was faster because it the yeast multiplied and made gas sooner.
The Bread Bible discussed mixing dough and kneading dough by hand, in electric mixers, and in food processors. It had a chapter on bread machines.
Bread Machine Cookbook
The Bread Lover’s Bread Machine Cookbook (“BLBMC“) was published by the Harvard Common Press in 2000. I have had a copy for over a decade. I discussed the 2000 edition in this blog in a post first published in 2020, edited extensively in 2025.
The 2000 edition has good sections on ingredients, dough and baking in general. It explained how bread machines could consolidate mixing, kneading, fermentation and baking reasonably good bread in a pan, in a small device. The book had several problems.
In 2023 and 2024 Quarto (a company related to Harvard Common) published two books based on the BLBMC. Both were placed with Walmart and Target stores, and on Amazon, where a book complements the sale of bread machines. Both were sold to libraries and educational web sites and services. The new books:
2023 – Bread machine baking for beginners : effortless perfect bread (“Beginners“), an “affordable abridged edition” of the BLBMC; and
2024 – a “newly revised and expanded” edition of the BLBMC.
The posthumous editions are not new. They do not overcome the problems of the 2000 edition. They extended the life of this book as a profitable title for the publisher, and perhaps for Hensperger’s estate.
The Artisan
Who
Peter Reinhart has been a baker, entrepreneur, competitive baker, advocate of collaboration among bakers, educator and consultant. He discussed his life in a chapter of Peter Reinhart’s Whole Grain Breads (2007). He baked while a member of troupe of performers in the 1970s, and in a group operating a whole food cafe in Boston. He became a member of a New Religious Movement called the Order of MANS, a Christian group organized like a Catholic religious order. He spent several years working in social service. He was one of the founders of Brother Juniper’s Cafe in Sonoma in 1986. Brother Juniper was named for Junípero Serra, the 18th century Spanish missionary beatified by the Roman Catholic Church in 1988. The objections of Americans descended from Indigenous people to the Spanish catholic missions in California in the 17th century did not influence 20th century entrepreneurs and consumers.
Peter Reinhart was an independent baker in California. Many of them competed against industrial bakeries (and against the independent bakeries that promoted “California” sourdough). He left Brother Juniper’s in 1993, and became an educator and promoter. He joined the Bread Baker’s Guild of America, and attended Raymond Calvel’s baking workshops in America in the 1990s. The James Beard Foundation’s award to him in 1995 for a bread baking competition gave him time in France to study the methods of highly regarded bakeries, which had evolved from Calvel’s work. He suggested that the encounters of Americans with French bread influenced a movement for artisanal baking in America. He later said, referring to the 1990s:
The word artisan lost lost its full impact the day that Safeway began using the brand name Artisan to describe their store-baked loaves.”
Peter Reinhart’s Whole Grain Breads, (2007)
His first book was Brother Juniper’s Bread Book: Slow Rise As Method and Metaphor (1991). He books in the 1990s and 2000s included:
Crust and Crumb: Master Formulas for Serious Bread Bakers (1998, 2006);
The Bread Baker’s Apprentice: Mastering the Art of Extraordinary Bread (2001);
American Pie: My Search for the Perfect Pizza (2003);
Peter Reinhart’s Whole Grain Breads: New Techniques, Extraordinary Flavor (2007);
Peter Reinhart’s Artisan Breads Every Day (2009)
The Baking Teacher/Chemist
Who
Emily Jane Buehler worked in a coop bakery, and later in Weaver Street Bakery in Carrboro, North Carolina. She met Peter Reinhart at a bread even in Asheville in 2006, and is mentioned in his 2007 book. She taught community courses before she wrote Bread Science which she published:
in print using the publishing firm name Two Blue Books in 2006 and
as an e-book in 2014, republished in 2021 in a 2nd edition.
She researched the science of grain, milling, dough and baking in the professional journal collections of the University of North Carolina, Chapel Hill.
She presents the science of gluten and fermentation, the practical technique of handling dough, an explanation of bakers’ percentage, and a discussion of the techniques of making and using pre-ferments (also known as sponges and starters). These techniques and stages affect fermentation, which affects the rising of the dough and the flavour of the bread. They are used in making sourdough bread, and less common – actually rare – in making yeasted bread. Chemically leavened bread rises in proportion to the amount of chemical leavener, water, starch and heat.
The Sourdough Professor
Who
Eric Pallant, professor of Environmental Science & Sustainability at Allegheny College in Meadville, Pennsylvania, USA . He is a practitioner of sourdough baking.
Dr. Pallant was introduced to sourdough when he was given a sourdough starter when he was a new assistant professor in 1988. Sourdough Culture (2021) is organized around his investigation of the story that the starter given to him was descended from a starter given to a backpacker hiking near Cripple Creek, Colorado in the 1970s, said to have been started during the 1893 gold rush near Telluride, was propagated and came into his possession a century later. Dr. Pallant has written about sourdough baking on the Web at Maurizi0 Leo’s The Perfect Loaf site. (Pallant’s posts and essays on that site are indexed.) The site has been published since 2012. Maurizi0 Leo has published a book of the same name in 2022 and has recorded several videos on a YouTube channel of the same name.
Sourdough Culture
Sourdough Culture (2021) addressed the history of baking in sections on archeology, the wheat trade in the Roman Empire, and the ovens and bread of Pompei. I found this book almost by accident, as I was looking for another book in the stacks at a branch of my local library system in 2025.
Videos
YouTube videos that demonstrate technique and what dough looks like as it is kneaded. Search tools drive users to sift through many search returns. Lesaffre’s Red Star brand has some useful videos on its channel:
The Babylonians, the Egyptians and the Romans had mechanical kneading drives driven by human or animal labour. Europeans used human labour to knead bread until the energy transformations and innovations of the 18th and 19th centuries.
Mixers
Modern professional bakers work with hundred of kilograms of flour and water. Professional bakers have control over how long to mix/knead, rise (ferment/proof), bake, and over oven temperature. Ingredients are mixed and kneaded in large industrial mixers, fermented, put into pans and put into ovens, baked, turned out and packaged. The dough goes into pans in small irregular lumps. It has to rise and flow to fill the pan, spring when pans go in the oven, but not spring above the limited headspace of the pan. Professional bakers may use 10-15 minutes of “intensive mixing” – the mechanical mixing of yeasted white flour dough was dominant in professional bakeries for French loaves until Raymond Calvel devised the hybid style in the 1960s. Intensive mixing develops gluten in white flour rapidly. Home bakers with stand mixers use slower speeds due to limitations of machinery (see the stand mixer review by America’s Test Kitchen in print and YouTube) or to use a hybrid, modified or improved mixing method. Overmixing is a risk for professional bakers using industrial mixers. Machine mixing can stretch dough too much or too often, breaking the gluten strands. An overmixed dough cannot hold the gases, and will not rise. Intensive mixing may affect a loaf with effects short of the complete failure caused by overmixing. Home bakers can have the same problem.
Mixers available to the home baker:
Food processors can mix dough, although a food processor might only handle 3 cups of flour, and has one speed – very fast. The mixing time may be less than a minute. Some food processors have a dough speed and/or special blade to mix dough. The risk of overmixing dough in a food processor is well recognized.
A home stand mixer can handle several cups of flour, at low-medium speed settings. The power output of a Kitchen Aid stand mixer with a 5 quart bowl may be 325 watts. Larger stand mixers may output 800 watts. A Bosch Compact Kitchen Machine may output 400 watts into its dough hook in its stand mixer configuration. They have to be used at the right settings and for a short time.
A bread machine can mix and knead dough using the machine’s dough program.
I make a soup from a recipe in the book Vegan Under Pressure by the nutrition/cooking writer Jill Nussinow. Her web site is The Veggie Queen. She promotes the book on her web site. I also refer to Hip Pressure Cooking, by the cooking writer Laura Pazzaglia for information about cooking in an electric pressure cooker. Both books were written before the Instant Pot came on the market, but are applicable to pressure-multi-cookers.
White Bean and Cabbage Soup
Jill Nussinow, in Vegan under Pressure (p. 162), for White Bean and Cabbage Soup recommends 1½ cups of dried Cannellini beans, soaked. Cannellini is a variety or cultivar of Phaseolus vulgaris, the American common bean. It is an oval white dry bean also often sold as the white kidney bean, nearly as large as a red kidney bean. 1½ cups of beans absorb most of 2½ cups of water overnight. She also suggests Great Northern beans and Navy beans, other Phaseolus vulgaris white beans.
The recipe gets color from the use of ¼ cup of chopped sun-dried tomatoes, and from diced fresh or canned diced tomatoes. I use no salt added canned tomatoes. It gets flavor from tomatoes and from onion, garlic, Italian seasoning and bay leaves. Salt is not listed as an ingredient.
Sun-dried tomatoes are dried in salt and have sodium. I use “ready to eat” sun-dried tomatoes sold in sealed pressed blocks by San Remo. I can buy these when a couple of local stored have them in stock. The tomatoes appear to be Turkish. The Food Facts label defines a serving of three tomatoes as 15 grams, and states this serving has 314 mg. of sodium. I try to get mix of larger and smaller tomatoes, and use 6 tomatoes, to get about 45 grams or ¼ cup of chopped pieces. The sun-dried tomatoes contribute about 900 mg. sodium and are the main source of sodium in this recipe.
White Kidney beans
For the last few years, I used the Walmart store brand Great Value dry white kidney beans for this soup but changed when Walmart stopped selling those dry beans.
Italian Seasoning
Jill Nussinow’s recipe for Italian Seasoning in Vegan Under Pressure (p. 41) makes just a little more than 160 ml – about ⅔ of a cup. I make a batch every few months.
It involves dried whole herbs or leaves (crumbled leaves), and a few ground spices:
Ingredient
Amount
basil
3 Tbsp.
oregano
2 Tbsp.
marjoram
1 Tbsp.
parsley
1 Tbsp.
thyme
2 tsp.
summer savory
1 tsp.
rosemary (ground or finely chopped)
1 tsp.
dried minced garlic
1 Tbsp
dried minced onion
2 tsp.
dried red pepper flakes
≦ ½ tsp.
*optional: minced dried lemon peel or lemon verbena
2 tsp.
Availability of the component herbs depends on practices of the growers, wholesalers and the retail merchants. I had to search for dry crumbled summer savory when a small local herb firm stopped providing this herb to local grocery stores.
I bought a paperback copy of The Structure of Scientific Revolutions in the University of Manitoba Bookstore in the basement of the Student Union building, during the 1971-72 or 1972-73 term. It was not a required text. The book was embraced by sociologists, economists and political scientist seeking validation of claims by teachers of those areas of study as “science”:
The changes that occur in politics, society and business are often expressed in Kuhnian terms, however poor their parallel with the practice of science may seem to scientists and historians of science. The terms “paradigm” and “paradigm shift” have become such notorious clichés and buzzwords that they are sometimes viewed as effectively devoid of content.
An article in the magazine The New Republic discussed the the meaning and use of the terms paradigm and paradigm shift in since the early ’70s:
For the culture at large, Structure’s greatest contribution has been linguistic—the notion of “paradigm change” as a synonym for “thinking outside the box.” But read in 2024, in light of the current history wars, the real revolution at the heart of Structure was a paradigm shift in scientific narrative. Who gets to tell the story of a field? And how truthful should they be in their telling?
The article examined Kuhn’s influences and context including the idea of science in the early ’60s:
… when a young Kuhn was teaching the history of science at Harvard. Kuhn’s tenure at Harvard coincided with the waning years of the presidency of James B. Conant, a chemist who had long left the lab in favor of scientific and political administration. …
… Conant sought a pedagogical strategy that could cultivate a new generation of curious scientists and instill respect for science among nonscientists but that would also carefully calibrate citizens’ questioning of authority.
Conant’s solution was historical method. Shortly after the war ended, Conant began teaching a new course on the history and philosophy of science for Harvard undergraduates. In a turn that was unusual for courses in the history of science at the time, Conant covered scientific wrong turns and dead ends, including alchemy and theories of spontaneous generation. Kuhn’s experience of teaching a version of this course transformed his understanding of the history and philosophy of science.
This crucial context explains the book’s otherwise peculiar obsession with scientific textbooks. The problem with textbooks, as Kuhn repeatedly explains, echoing Conant, is that they obscure scientific debate and prior explanations in the name of inducting students into the reigning understanding of how the world works—that is, a scientific paradigm. These textbooks, he claims, have to be “rewritten” when normal science changes, because they “refer only to that part of the work of past scientists that can easily be viewed as contributions to the statement and solution of the texts’ paradigm problems.”
….
Kuhn claimed, both in 1962 and for the rest of his career, that he had not intended any of this as an attack on the scientific enterprise itself. For Kuhn, the entire point of Structure was to elucidate what he and many scientists of his generation saw as science’s distinctive ability to build cumulative knowledge.
….
… Kuhn himself acknowledged one critical way in which his account of scientific progress diverged from common understanding: It had nothing to do with truth. Instead of thinking of science as a process that inevitably draws closer to natural reality, Kuhn suggested that we treat scientific change as an evolutionary process … in which various paradigms compete for community advantage.
Ibid
The article also examined whether Kuhn had contributed to the popularity of European philosophical trends, such as structuralism, critical theory and Foucalt’s theories of power, authority and knowledge among academics and the general public:
By the mid-1980s, a new generation of historians, sociologists, and anthropologists of science brought a more critical lens to scientific power. They incorporated ideas about race, sex, gender, national and historical context, and, most importantly, power into their analyses of what drove scientific communities to embrace some theories and reject others. Defenders of science took to calling this approach “Kuhnian,” to Kuhn’s everlasting chagrin. The charge was ridiculous then and ridiculous now: Structure’s approach to its topic is in …intellectually conservative, given that it excludes the natural and social sciences and any discussion of technology or … “external social, economic, and intellectual conditions in the development of the sciences.”
Ibid
Another article “The Realist and the Pragmatist” in the online edition of the magazine Aeon (not paywalled at the time), discussing paradigms in epistemology. She discussed Kuhn in the context of theories articulated in logical empiricist school of philosophy by Rudolph Carnap. She contrasts framed enquiries and framing enquiries. She suggests the latter lead to what Kuhn called ‘paradigm shifts’ and notes that:
… in framed enquiry, the framework constrains the space of possible answers, while in framing enquiry, the issue is more open-ended. We do not aim at a predetermined target in the same way that a murder investigation aims at finding out who the murderer is. When we discuss our conceptions of democracy, gender, efficiency, the goal is to build conceptual structures that help us make sense of the world, given our purposes. There is no right answer to be found ‘out there’
….
This is not to say that, when we engage in framing enquiry, we should give up on any ideal of objectivity. The open-endedness of framing enquiry does not amount to a free-for-all pass to choose or create the framework that fits one’s prior beliefs and desires. In fact, doing so would be the opposite of open-endedness, since it would subordinate the entire enquiry to predetermined ends. Instead, facts matter in framing enquiry because there is a constant iterative adjustment between frameworks and facts. … . Reasons, arguments and evidence still have a central role to play in framing enquiry.
This is why it is important to know when we are engaged in a framed or a framing enquiry. Unfortunately, it is not always straightforward to tell, especially from the inside. First, the distinction between framed and framing enquiry is a spectrum rather than a dichotomy, and that complicates matters. Many of our daily investigations are very clearly on the framed end of the spectrum: why is the kitchen sink leaking? How many eggs do we have in the fridge? But in more complex enquiries, whether in science or politics, the boundaries between framed and framing enquiry are blurred, as we most often alternate between the two.
Publishers and librarian almost always state the length of a printed book in pages. Some works may also count words. The length of a page depends on the size of the printed characters, the margins and the line spacing, as well as the area of the page.
The size and shape of a character is determined by the typeface, the font, and the font size. For the metal type used in print printed page, the basic font size is measured in points. A desktop publishing point is 1/72 of an inch (0.3527 mm). The publishing industry considers 12 points (i.e. 1/6 inch; 4.234 mm, just less than 0.5 cm) to be a visible height for the standard reader. However some font in printed work are 10 or 9 points high, and some text (e.g. superscipts, subscripts, footnotes, endnotes) is smaller.
Librarians shelve some printed works as “large print“. The font is usually 18 points high, but the American National Association for Visually Handicapped (NAVH) standard for its approval mark is 14 points.